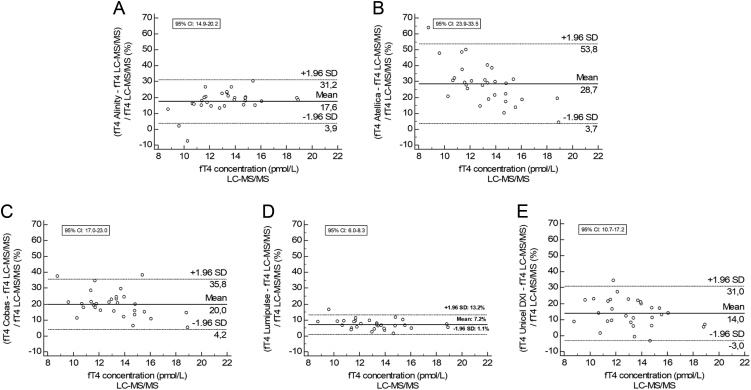
Figure 4.
Bland–Altman plots for the five automated immunoassays in pregnant women compared to healthy controls. To provide better insight into the absolute effect of the matrix of pregnant women, we recalculated the IA results toward the LC-MS/MS results based on the method comparison for healthy controls by the following formula: (initial fT4 measured using IA – intercept)/slope. The recalculated concentrations from pregnant women were used to make these Bland–Altman plots. On the x-axis, the mean fT4 concentrations in pregnant women measured using LC-MS/MS were shown and, on the y-axis, the % deviation of the respective IAs compared to the LC-MS/MS assay were shown. (A) Alinity; (B) Atellica; (C) Cobas; (D) Lumipulse; (E) UniCel DXI.

 This work is licensed under a