
Figure 2: Chronic CED of TPT targets proliferating tumor populations and shifts tumor phenotype.
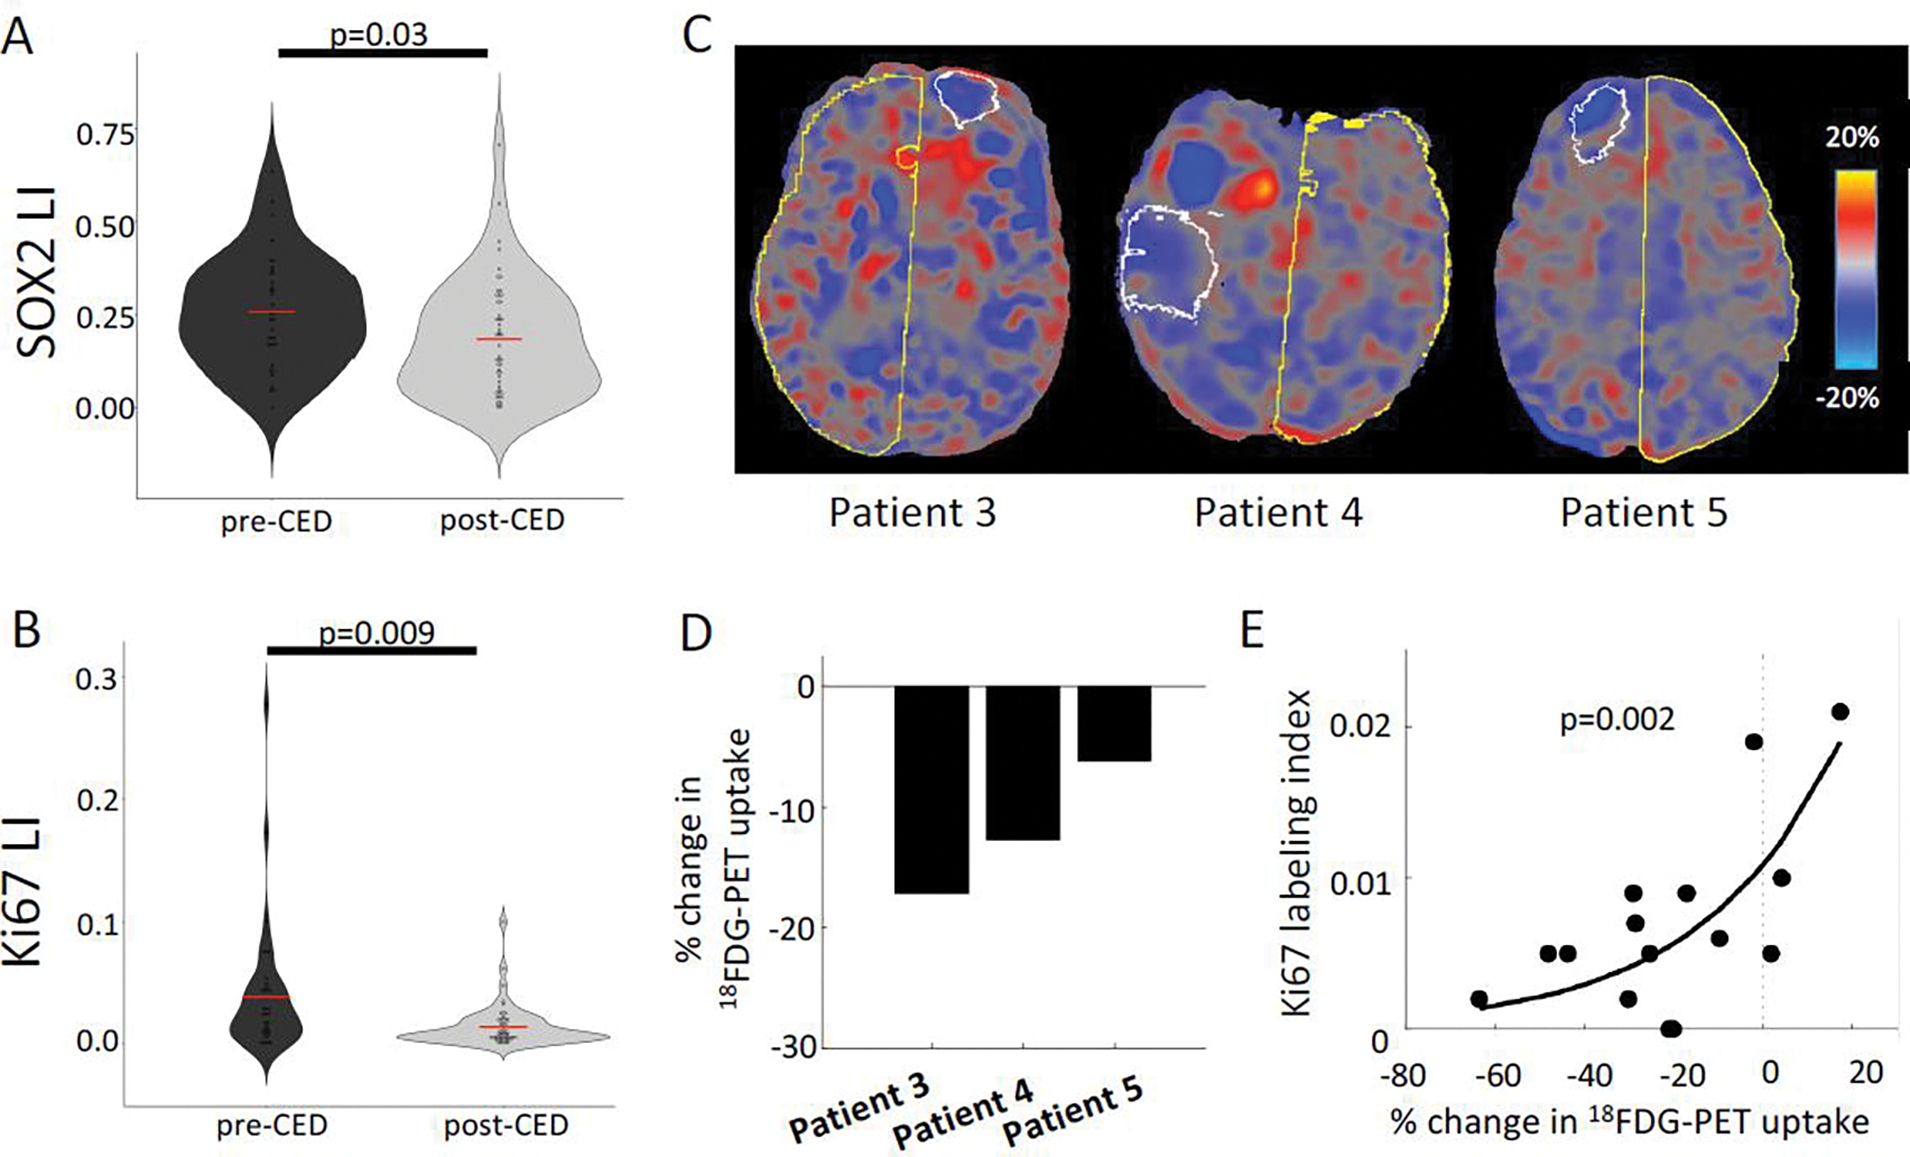
A-B: Violin plot displaying quantification of SOX2 (glioma marker) and Ki67 (proliferation marker) by labeling index across all MRI-localized biopsies from all patients, comparing biopsies taken pre- and post-CED using a student’s T-test (n=86). C: PET scans were performed on the last 3 patients in this series. The difference between post- and pre-infusion PET images were computed and converted to percent signal change. The white outline represents the maximum infused volume; the yellow outline represents the control hemisphere. Blue voxels represent decreases in metabolism, red voxels represent increases in metabolism, and gray voxels represent no change after treatment. D: All three patients showed a large (6.2–17.2%) reduction in metabolism within the infused volume mask. E: The regions treated with TPT demonstrated reduced Ki67 labeling and reduced 18FDG metabolism (n = 14). These two measures were exponentially related, such that, the larger the reduction in metabolism, the lower the proliferation index.