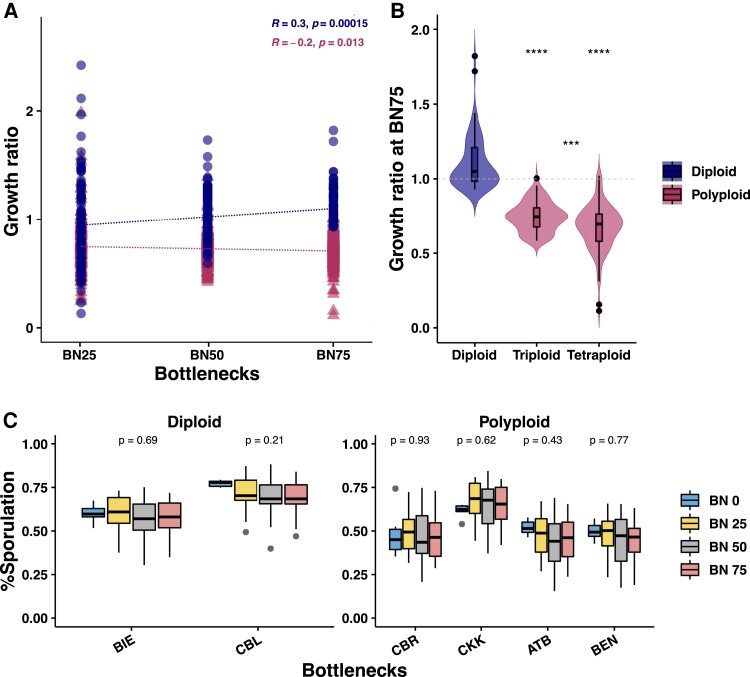
Fig. 5.
(A) Mean growth ratio in the individual MA lines (bottlenecks 25, 50, and 75) compared to the ancestral isolates (bottleneck 0) traced over the course of the experiment. Diploid MA lines display positive growth trend (Spearman’s R = 0.3; P < 0.01), while polyploids display a negative growth trend (Spearman’s R = −0.2; P = 0.013). (B) Violin plot representing growth in the MA lines at the end of the experiment (Wilcoxon test, *P < 0.05; **P < 0.01; ***P < 0.001; ****P < 0.0001; ns, not significant). (C) Sporulation efficiencies do not change in the evolved MA lines compared with the ancestral isolates. BDL, ARN, and BEK ancestral isolates as well as the evolved MA lines did not sporulate. Spore viability percentages at bottlenecks 0 and 75 are shown.

