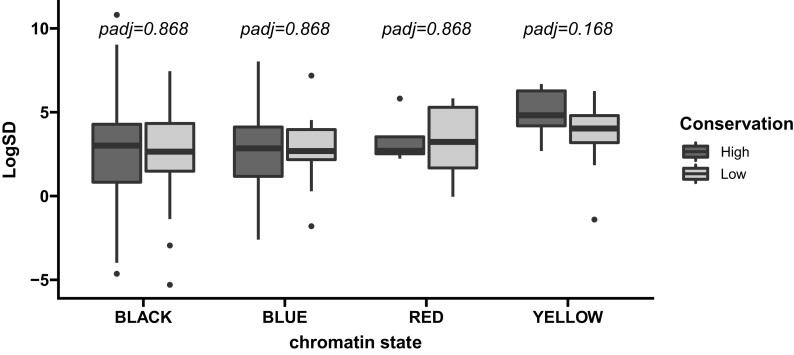
Fig. 10.
Comparison of gene expression constraint for highly and lowly conserved TADs separated by chromatin state. We compared log2 of the standard deviation in gene expression (LogSD) for low and high conservation TADs within each chromatin state. Two-sided Wilcoxon rank sum tests were used to compare LogSD between conservation classes and resulting values were corrected using the Benjamini–Hochberg procedure. Green TADs were exclusively low-conservation and were excluded.

