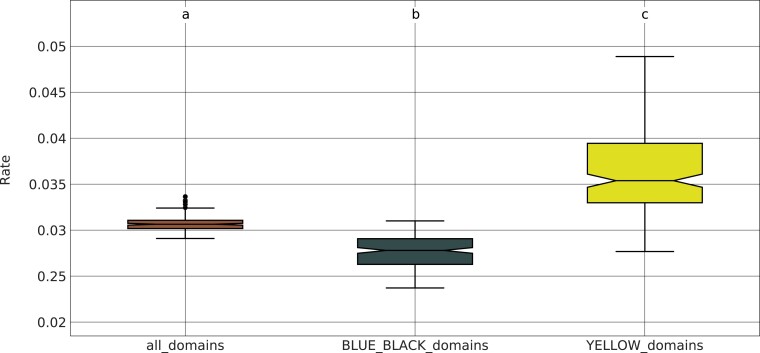
Fig. 6.
Evolutionary rate comparison for active versus developmentally regulated TADs. We divided our TAD presence/absence matrix into two submatrices: one containing developmentally regulated TADs (i.e., those enriched for BLUE or BLACK chromatin states) and another containing active TADs (i.e., those enriched for the YELLOW chromatin state). We used a maximum-likelihood approach to estimate the rate of TAD substitutions separately for these two categories using 100 bootstrap replicates. Developmentally regulated TADs have a significantly reduced rate of evolution compared with active TADs (the Wilcoxon rank sum test ). We also included the complete matrix of all TAD orthogroups for comparison. The substitution rates for this matrix are significantly higher than those from the BLUE/BLACK submatrix and significantly lower than those from the YELLOW submatrix (the Wilcoxon rank sum test and , respectively).

