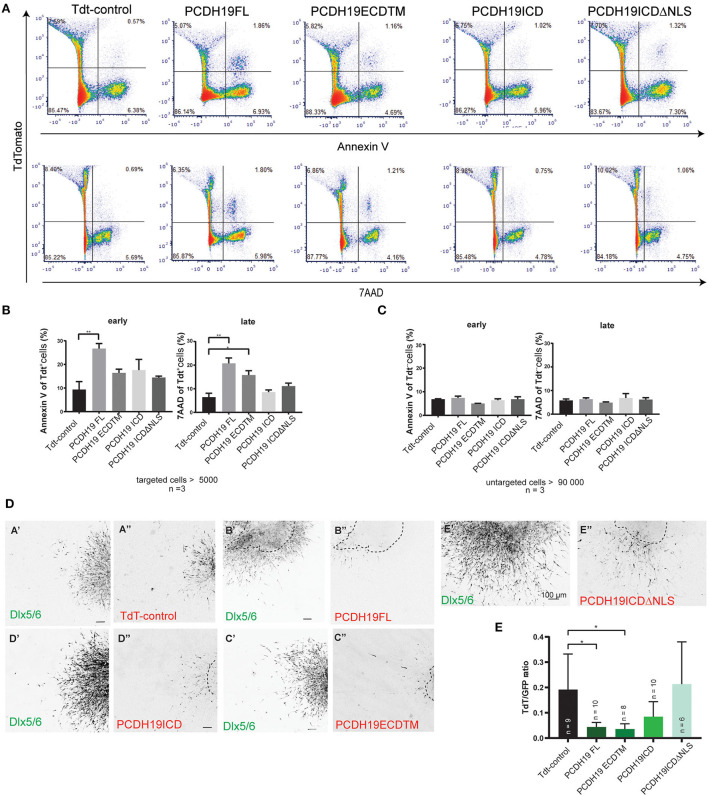
Figure 5.
PCDH19 ECD overexpression increases apoptosis in Neuro 2A-transfected cells and might induce apoptosis in MGE electroporated INs. (A) Examples of flow cytometry pseudo color plots after 48 h of transfection of control and PCDH19 constructs. Early apoptotic detection is shown by AnnexinV fluorescence [(A), the upper row], and late apoptotic detection is shown by 7AAD fluorescence [(A), the lower row]. (B) Quantification of early apoptotic targeted cells indicated significant increase in PCDH19 FL compared to TdT control (the right panel, Welch ANOVA, and the Dunnet's post hoc test, **p = 0.0025). Similarly, quantification of late apoptotic cells yielded significant increases in PCDH19 FL, PCDH19 ECD TM compared to Tdt control [the left panel, Welch ANOVA, and the Dunnet's post hoc test, **p = 0.0038 (PCDH19 FL) *p = 0.0112 (PCDH19 ECDTM)]. (C) Untargeted cells showed no significant differences in early nor in late apoptotic cells. (D) Explant examples of the control plasmid and the diverse PCDH19 constructs depicted in the GFP channel (Dlx 5/6) and in the red channel (TdT, PCDH19-eGFP-IRES-TdT constructs). Areas and shapes differ within the different experimental conditions; the original explant boundary is indicated by the dotted line. (E) Quantification of TdTomato intensity (a proxy for amount of targeted cells) relative to the GFP signal (Dlx5/6 INs) and normalized to the size of an explant. Significant less TdTomato-expressing cells are found upon overexpression of PCDH19 FL and PCDH19 ECDTM [the Kruskal–Wallis non parametric test and the Dunn's post hoc test, *p = 0.0229 (PCDH19 FL) and *p = 0.0219 (PCDH19 ECDTM)].

