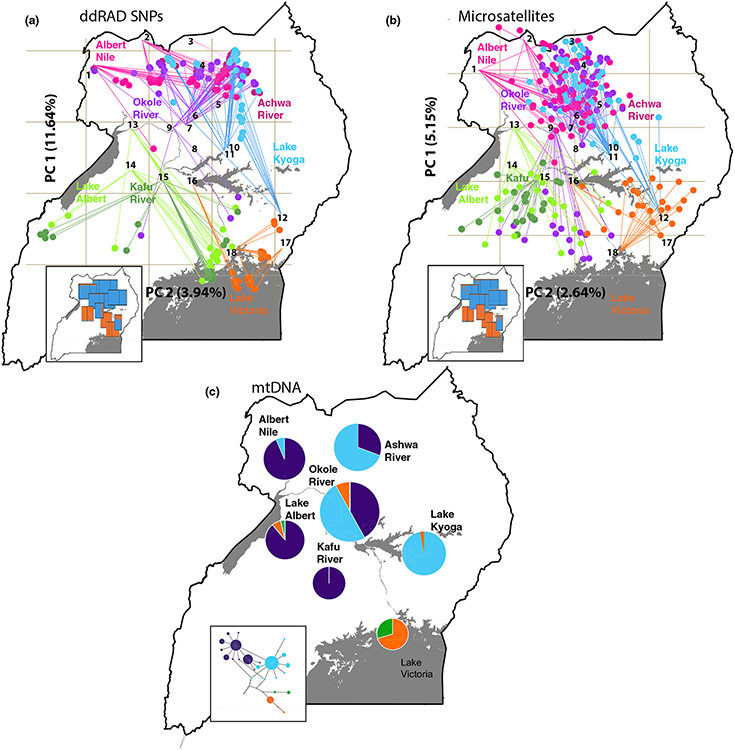
FIGURE 3.
Genetic structure of Glossina fuscipes fuscipes in Uganda, including (a) principle components analysis (PCA) plots for 55,267 ddRAD SNPs, (b) PCA plots for 16 microsatellites, and (c) the frequency of groups of related mtDNA COI-COII haplotypes. In (a) and (b) each individual is indicated with a point connected by a line to the site of origin, and are colored by watershed of origin (Albert Nile in pink, Ashwa River in magenta, Okole River in purple, Lake Kyoga in blue, Lake Albert in light green, Kafu River in dark green and Lake Victoria in orange; see Supporting Information Table S4) for PCA plots of PC1-PC4 without the map), and the insets display structure version 2.3.4 (Pritchard & Stephens, 2000) results at K=2 (see Supporting Information Table S6) for full size). In (c), groups of related haplotypes are shown in the same colors (Haplogroup A in purple, Haplogroup B in blue, Haplogroup C in orange, and Haplogroup D in green), and the inset displays the TCS haplotype network (see Supporting Information Table S11) for full size).

