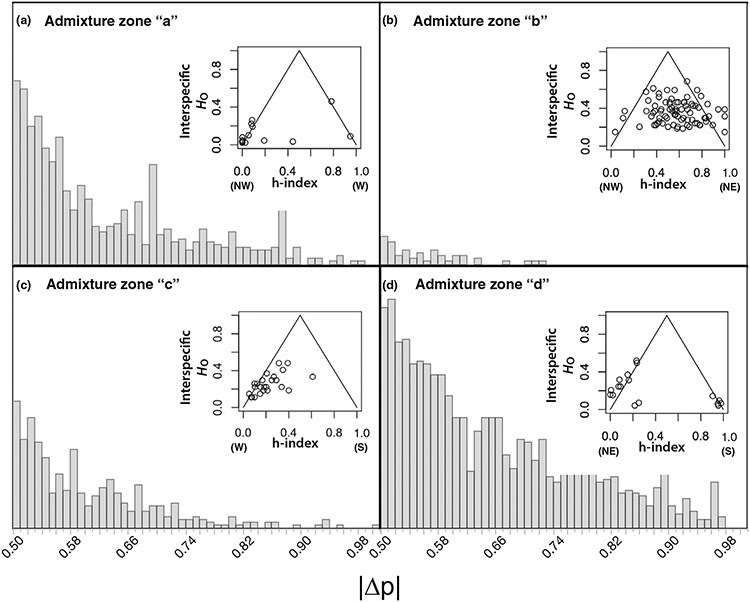
FIGURE 4.
Characterization of the Glossina fuscipes fuscipes admixture zones in Uganda using INTROGRESS v. 1.2.3 (Gompert & Buerkle, 2009) for (a) admixture zone “a”, (b) admixture zone “b”, (c) admixture zone “c”, and (d) admixture zone “d”. The main plots show the histograms of the absolute allele frequency difference (∣Δp∣) estimated from 33,057 unlinked ddRAD SNPs. Insets show triangle plots of the “interspecific” heterozygosity (HO) against “hybrid index” (h-index) estimated with a subset of SNPs with high ∣Δp∣ (0.8 for admixture zones “a”, “c”, and “d”; 0.5 for admixture zone “b”), wherein first generation hybrids appear at the apex, advanced generation hybrids occur in the center, and parental types occur in the bottom left/right, with the genetic cluster that represents that parental type indicated with abbreviations: northwest (NW), northeast (NE), west (W), south (S).

