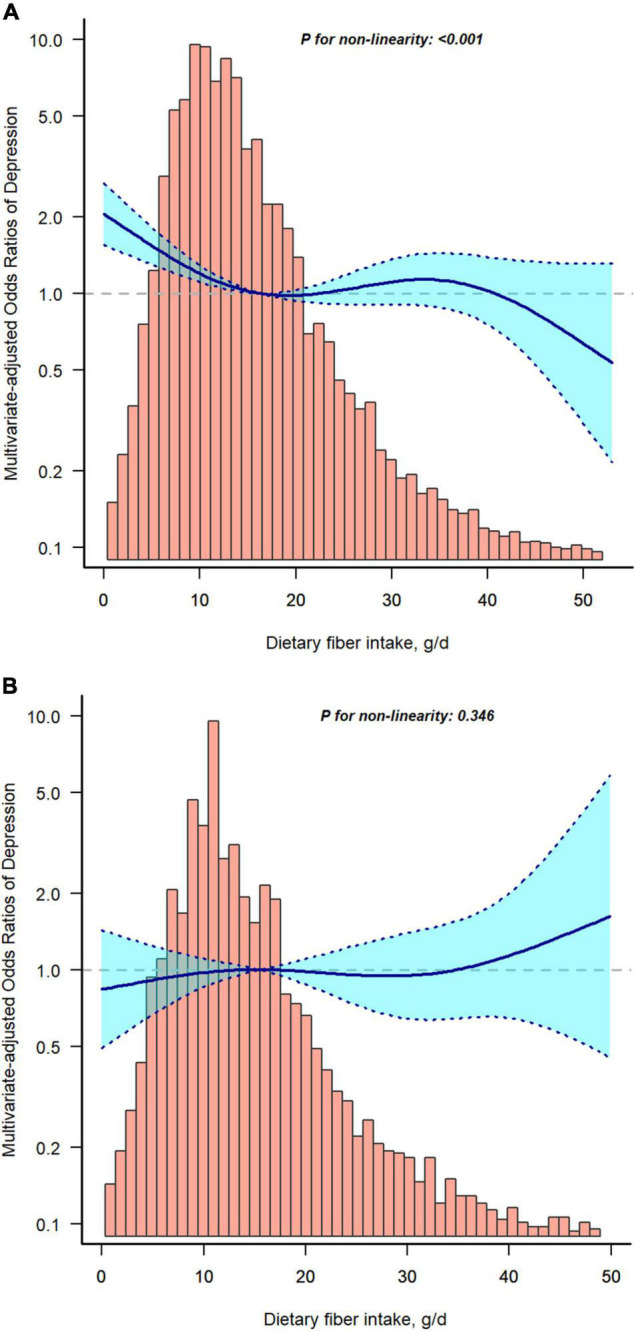
FIGURE 2.

Restricted cubic spline model of the odds ratios of dietary fiber intakes with depression without type 2 diabetes (T2D) (A) or with T2D (B). Adjusted for age, gender, race/ethnicity, body mass index (BMI), educational level, poverty to income ratio (PIR), smoking status, alcohol consumption, physical activity, hypertension, and total daily energy intake. The dashed lines represent the 95% confidence intervals.
