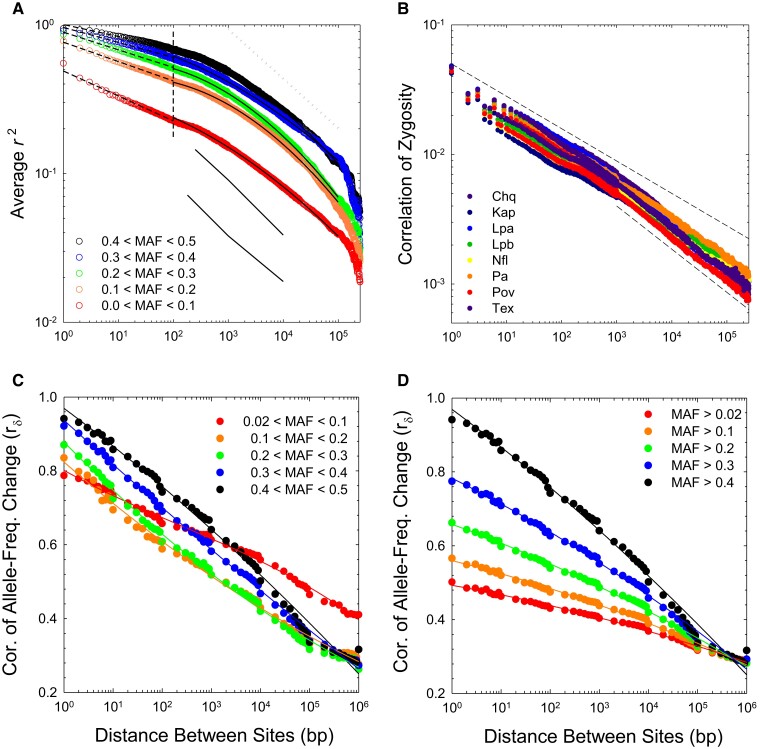
Fig. 1.
(A) Response of average population-level to increasing distance between sites. The vertical dashed line at bp denotes the approximate break point in the scaling behavior of LD with physical distance between sites; fitted least-squares regression parameters above and below this threshold are given in supplementary table 3, Supplementary Material online. The upper dashed line provides a reference for 1/3 power-law scaling. The lower, thin lines give the average estimates of for D. melanogaster taken from figure 1 in Garud and Petrov (2016); upper and lower lines denote data for samples from Raleigh and Zambia, respectively. (B) Response of individual-level to increasing distance between sites for the eight study populations. Upper and lower dashed lines denote power-law scaling behavior with slopes of and , respectively. (C,D) Average correlations of allele-frequency changes between adjacent years in the series of samples from population PA, plotted with two different binnings of frequencies.

