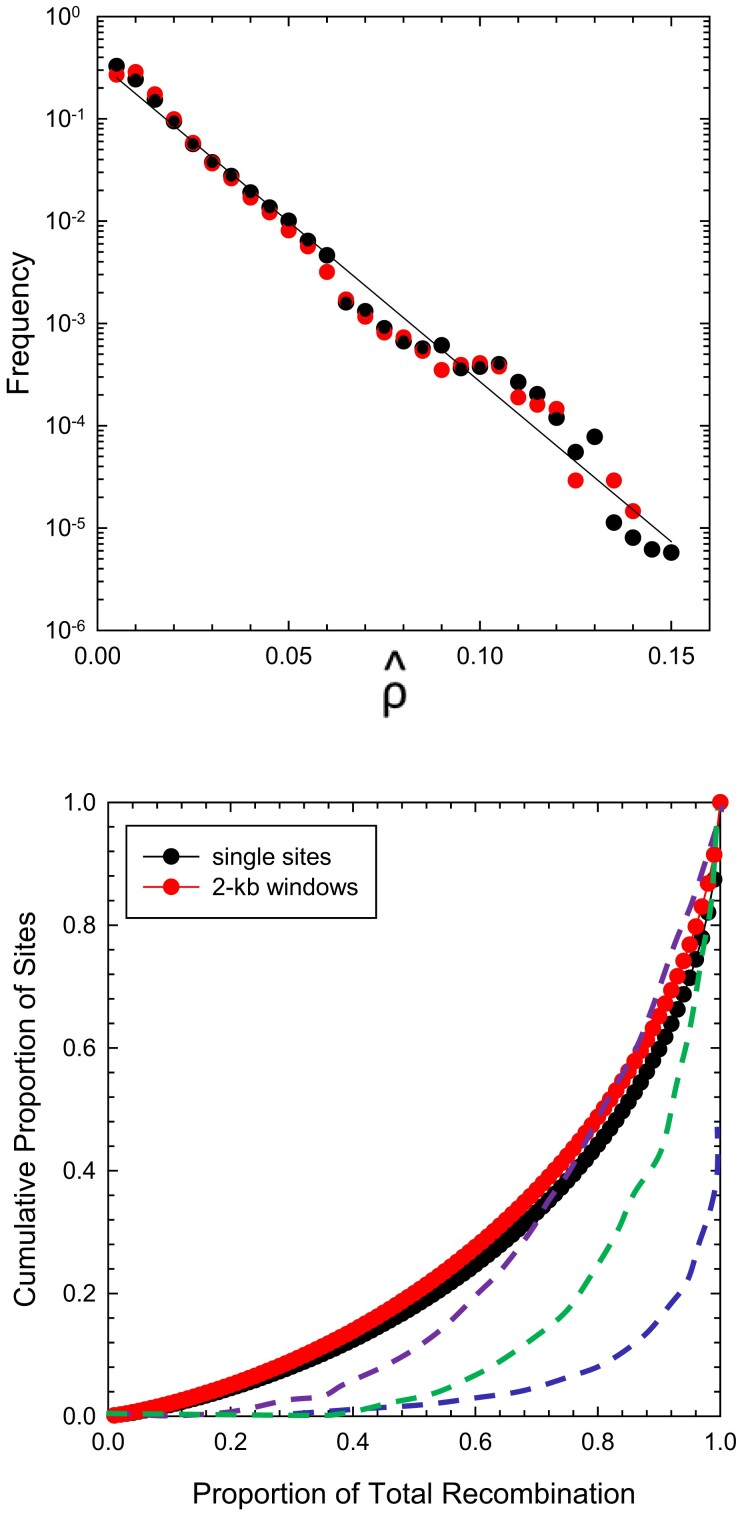
Fig. 4.
(Above) Frequency profiles of the estimates of the population-averaged scaled recombination rate on a per-nucleotide and a per 2-kb window basis, based on 137,643,518 sites and 68,821 windows. The least-squares regression of log (frequency) on has intercept and slope (). (Below) Cumulative distributions for the data in the upper panel (which utilizes the same red/black color scheme for Daphnia). In ascending order, the dashed blue line is the function derived for European human populations (taken from fig. 2 in Auton et al. 2012), green for mouse (Paigen et al. 2008), and purple for Drosophila pseudoobscura (Smukowski Heil et al. 2015).

