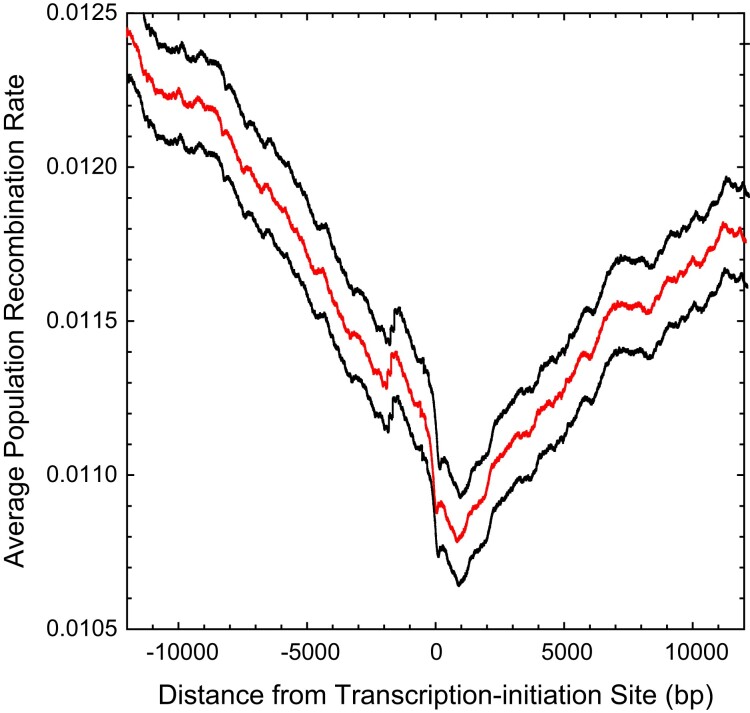
Fig. 6.
Average population-scaled recombination rate, as estimated by LDhat, as a function of the distance from the transcription–initiation sites of all genes for which such positions are known; the black lines denote 2 standard errors of the means (intermediate line). The horizontal dashed line denotes the genome-wide average recombination rate.

