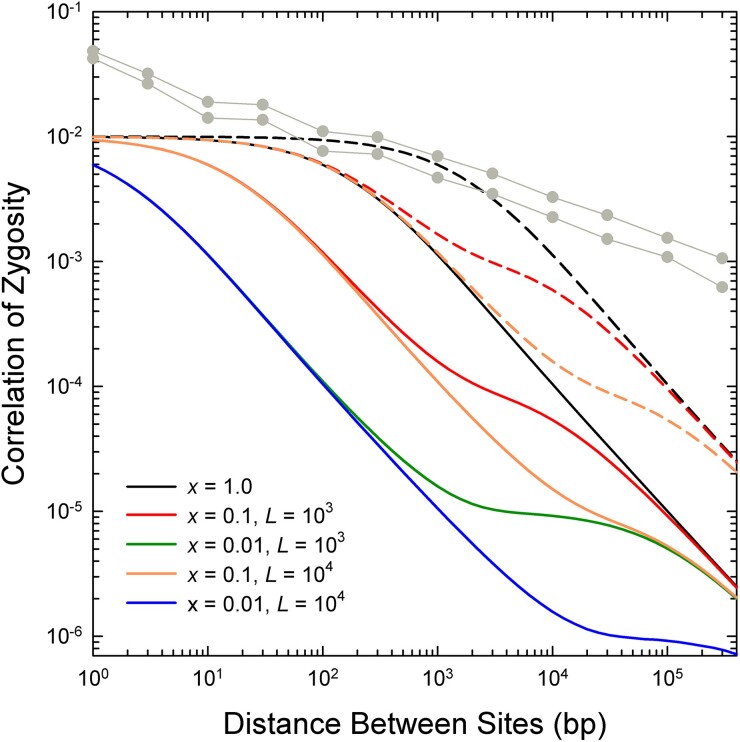
Fig. 8.
Expected pattern of decline of the correlation of zygosity () with increasing physical distance between sites as a function of , the fraction of recombination events resulting in a crossover, and , the mean length of a gene-conversion tract (in bp), under the assumption of an exponential length distribution of the latter. Derived using equation (8) in Lynch et al. (2011), based on equilibrium theory of Ohta and Kimura (1971) and Hill (1975), and equation (1) in Frisse et al. (2001). It is assumed that the population mutation rate is , as observed in Maruki et al. (2022), and that the population recombination rate per site per generation is , as described in the text. Solid and dashed lines denote results for a periodicity between sexual bouts of and generations, respectively. From Lynch et al. (2014), the same scaling is expected for the squared linkage disequilibrium coefficient, , which is approximately equal to . The light gray lines with data points give the upper and lower bounds of for the actual genomic analyses in figure 1B.

