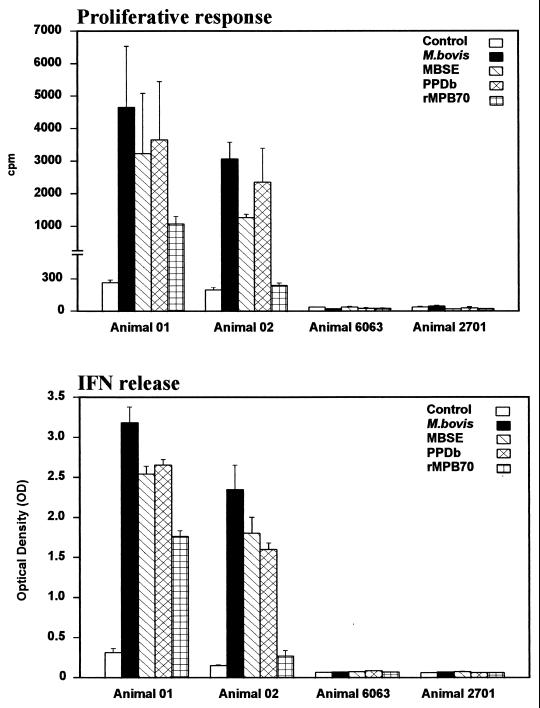
FIG. 4.
Proliferation (top) and IFN-γ production (bottom) of MACS-separated CD8+ T cells in response to M. bovis (106 CFU/ml), MBSE, PPDb, and rMPB70 (4 μg/ml). The top panel shows the responses as cpm following [methyl-3H]thymidine incorporation. The bottom panel indicates the IFN-γ production assessed by ELISA and presented as OD450. Results are shown for experimentally infected animals 01 (two experiments) and 02 (three experiments) and for two noninfected control animals (animals 6063 and 2701) and are expressed as mean and standard error. The proliferation (cpm) obtained for APC alone in all the animals were similar to the control values. The OD450 obtained for APC alone were <0.8 for animal 01, <0.3 for animal 02, and <0.06 for animals 6063 and 2701.

