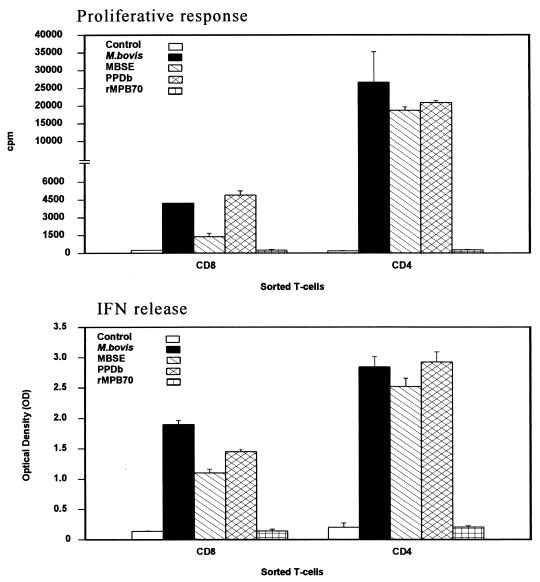
FIG. 5.
Comparison of the proliferative responses (top) and IFN-γ production (bottom) of CD8+ and CD4+ MACS-sorted T cells from animal 02 in response to M. bovis (106 CFU/ml), MBSE, PPDb, and rMPB70 (4 μg/ml). The top panel shows the responses as cpm following [methyl-3H]thymidine incorporation. The bottom panel indicates the IFN-γ production as assessed by ELISA and presented as OD450. The proliferative responses obtained for APC alone were similar to the control value. The OD450 values obtained for APC alone were <0.2.

