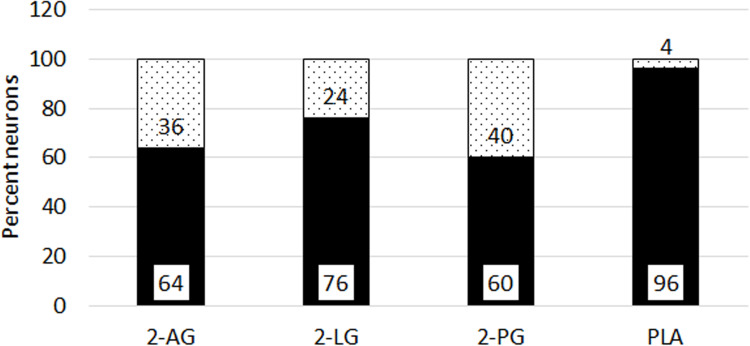
Figure 8.
Proportion of neurons with delayed responses. Graph showing percentage capsaicin sensitive neurons with delayed responses (black bars), and not delayed responses (grey bars), in the presence of individual 2-AG (N=11, 712 neurons), 2-LG (N=17, 688 neurons), and 2-PG (N=9, 561 neurons). Combined PLA (N=7, 178 neurons) showed the maximum proportion of neurons with delayed responses.

