Figure 6.
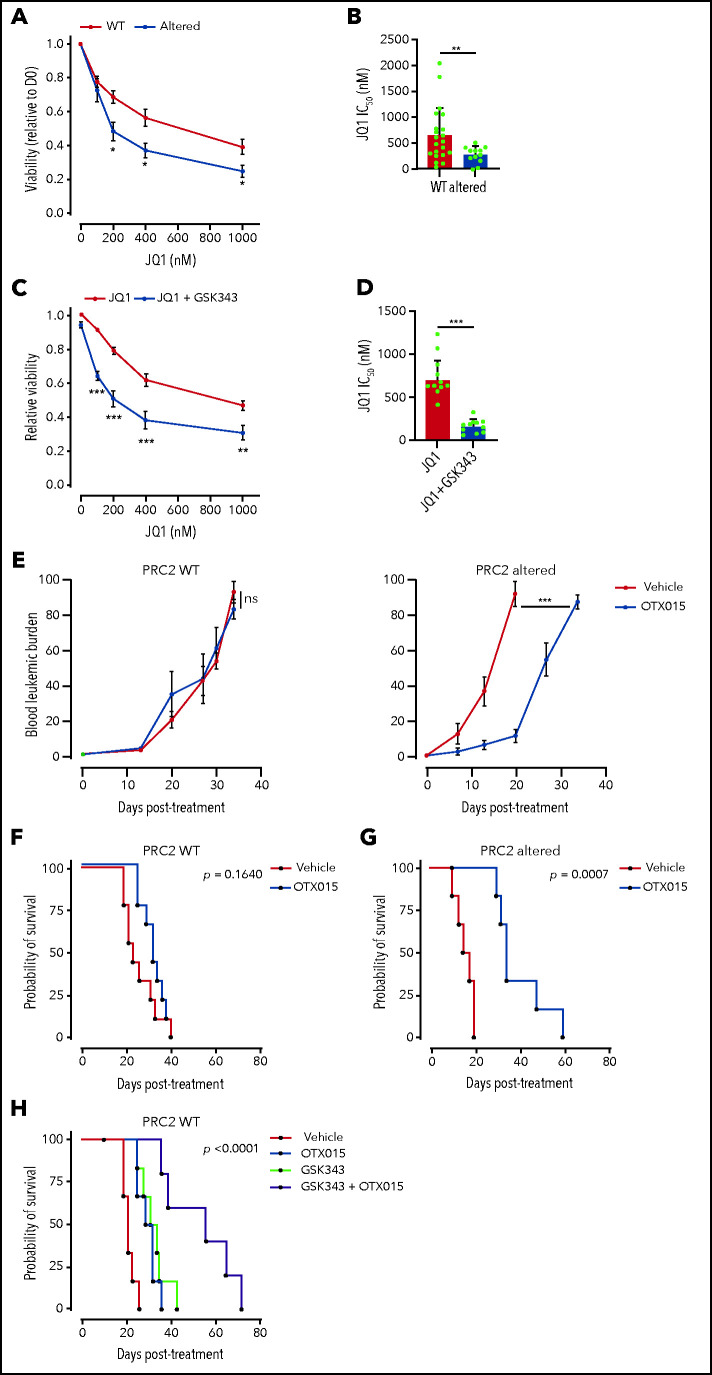
PRC2 loss of function sensitizes to BET protein inhibition. (A) Viability of T-ALL PDX measured after 3 days of treatment with JQ1 at the indicated doses. Means and SEM are plotted (WT n = 21, altered n = 12). (B) Bar graph of the computed JQ1 IC50 for each PDX. Means and SEM are plotted. Each dot represents a replicate (WT n = 21, altered n = 12). (C) Viability of T-ALL PDX measured after 3 days of treatment with JQ1 alone or combined with GSK343 (3 µM) at the indicated doses. Means and SEM are plotted (WT, altered: n = 10). (D) Bar graph of the computed JQ1 IC50 for each PDX. Means and SEM are plotted. Each dot represents a replicate (WT n = 10, altered n = 10). (E) Blood leukemic burden evaluated by flow cytometry of mice xenografted with either a PRC2 WT PDX (n = 3 per arm) or altered T-ALL PDX (n = 3 per arm) following 2 cycles of 5-day oral gavage with vehicle or OTX015 (25 mg/kg). These data are obtained from 1 PDX per group and are representative of the entire dataset. (F) Survival curves of mice xenografted with either PRC2 WT PDX (n = 3, 3 mice/arm/PDX) or altered T-ALL PDX (n = 3, 3 mice/arm/PDX) following 2 cycles of 5-day oral gavage with vehicle or OTX015 (25 mg/kg). (G-H) Survival curves of mice xenografted with PRC2 WT PDX (n = 5 2, 3 mice/arm/PDX) following 2 cycles of 5-day oral gavage with vehicle, OTX015 (25 mg/kg), intraperitoneal injection of GSK343 (5 mg/kg) (G), or a combination of the two (H).

