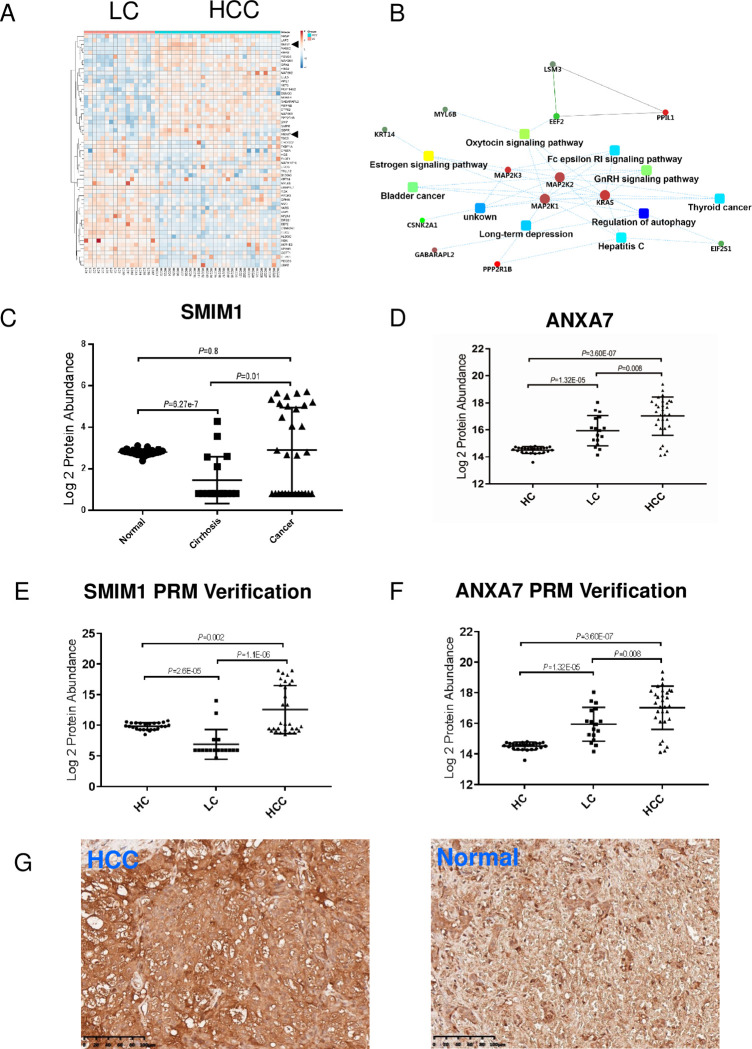
Fig 5. Alterations in RBCs and potential biomarker identification during tumorigenesis of LC to HCC.
A. Hierarchical clustering analysis of HCC and LC groups with DEPs. B. Interactive networks regulating the tumorigenesis of LC to HC. Networks connect the disrupted pathways and proteins in RBCs and were constructed using DEPs in LC and HCC groups. C–D. Analysis of SMIM1 and ANXA7 expression in a cohort of patients with LC, HCC, and HC, respectively. The protein expression was calculated from mass spectrometry data and a significant difference analysis was conducted between groups. E–F. The expression trends of SMIM1 and ANXA7 during tumorigenesis were verified using a PRM strategy with another batch of clinical samples from LC (n = 9), HCC (n = 11), and HC (n = 10). G. Immunostaining of SMIM1 in normal liver and HCC tissue.

