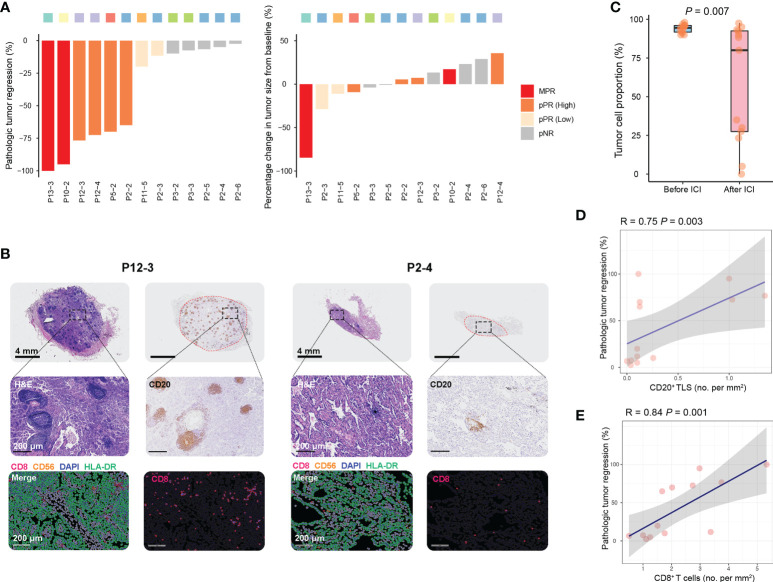
Figure 3.
Immune responses to Sintilimab in sMPLC. (A) Waterfall plots of pathologic tumor regression and radiographic change in resected GGOs after the use of Sintilimab. Primary endpoint: MPR (≤10% viable tumor cells), pPR (>10% and<90% viable tumor cells), and pNR (>90% viable tumor cells). GGOs with pPR were further grouped by median value of viable tumor cell percent. (B) Quantification of residual viable tumor, CD20+ B-cells, and CD8+ T-cells of GGOs with favorable or poor pathologic response. (C) Comparison of qualifying residual viable tumor before and after the use of Sintilimab. (D, E) The association between CD20+ B-cells and CD8+ T-cells densities and pathologic responses among GGOs underwent immunotherapy. Quantification methods of tumor infiltrated B-cells and T-cells were shown in Methods. MPR, major pathologic response; pPR, pathologic partial response; pNR, pathologic nonresponse; ICI, immune checkpoint inhibitor.

