. 2022 Oct 20;11:e76744. doi: 10.7554/eLife.76744

Figure 1. Diets enriched in saturated fatty acids lead to enhanced endotoxemia severity and altered systemic inflammatory profiles, independent of diet-associated microbiome.

(A–G) Age-matched (6–8 weeks) female BALB/c mice were fed standard chow (SC), Western diet (WD), or ketogenic diet (KD) for 2 weeks and injected intraperitoneal (i.p.) with 6 mg/kg of lipopolysaccharide (LPS). (A) Temperature loss and (B) survival were monitored every 2 hr. At indicated times, 10–20 μL of blood was drawn via the tail vein, RNA was collected, and samples were assessed for expression of (C) Tnf, (D) Il6, (E) Il1b, and (F) Il10 via qRT-PCR. (G) Il10:Tnf ratio was calculated for 5, 10, 15, and 20 hr post-injection (p.i.) with LPS. (H–N) Next, 19–23-week-old female and 14–23-week-old male and female germ-free C57BL/6 mice were fed SC, WD, or KD for 2 weeks and injected i.p. with 50 mg/kg of LPS. (H) Temperature loss and (I) survival were monitored every 5 hr p.i. (J–N) At indicated times, 10–20 μL of blood was drawn via the tail vein, RNA was collected, and samples were assessed for expression of (J) Tnf, (K) Il6, (L) Il1b, and (M) Il10 via qRT-PCR. (N) Il10:Tnf ratio was calculated for 5 and 10 hr p.i. with LPS. For (A–G), all experiments were run three times, and data are representative of one experiment, n=5 per diet group. For (H–N) SC, n=6; WD, n=5; and KD, n=9; and data are representative of one experiment. For (A, C–G, H, and J–N) a Mann Whitney test was used for pairwise comparisons. For (B) and (I) a log-rank Mantel-Cox test was used for survival curve comparison. For all panels, *p<0.05; **p<0.01; ***p<0.001. For (C–E), Φ symbols indicate WD significance, and ∞ symbols indicate KD significance. Error bars shown mean ± SD.

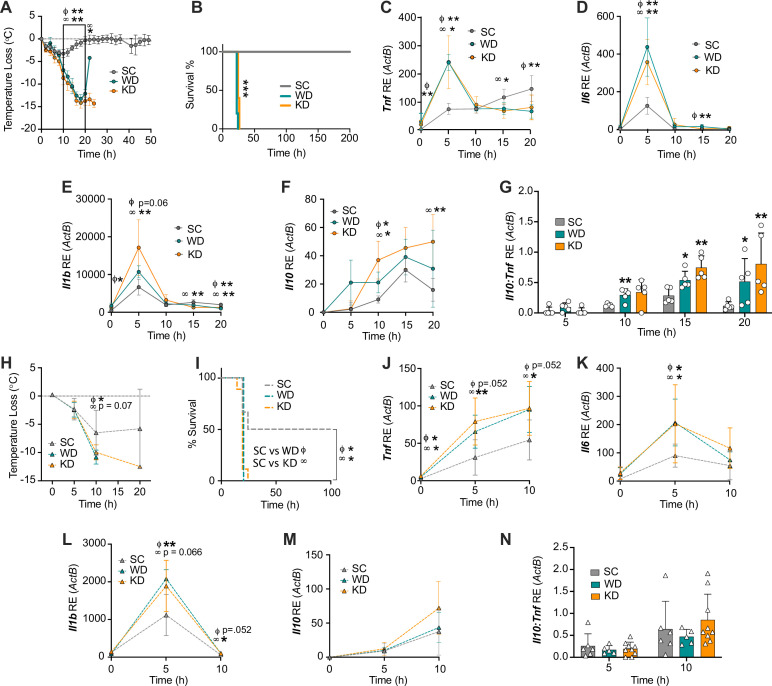
Figure 1—source data 1. Data and statistics for graphs depicted in Figure 1A–N.
elife-76744-fig1-data1.xlsx (957.8KB, xlsx)

Figure 1.

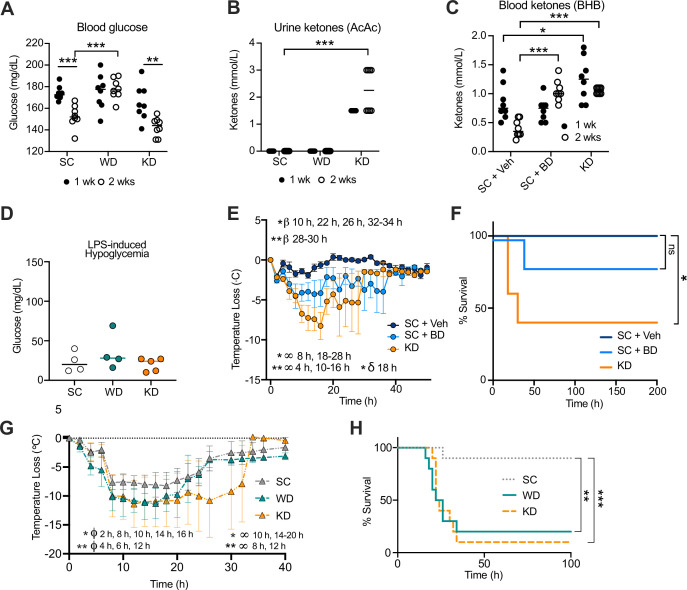
Figure 1—figure supplement 1. Increase in disease severity in ketogenic diet (KD) mice is independent of ketosis.

Figure 1—figure supplement 1.

Age-matched (6–8 weeks) female BALB/c mice were fed standard chow (SC), Western diet (WD), or KD for 2 weeks. At 1 week and 2 weeks, (A) blood was collected via the tail vein to measure blood glucose levels using a glucose testing meter (Keto-Mojo), and (B) urine was collected on ketone indicator strips to measure levels of systemic acetoacetate (AcAc). Age-matched (6–8 weeks) female BALB/c mice were fed SC supplemented with 1,3-butanediol (SC + BD) or with a saccharine vehicle solution as a control (SC + Veh), or KD for 2 weeks. At 1 week and 2 weeks, (C) blood was collected via the tail vein to measure levels of systemic β-hydroxybutyrate (BHB) using a ketone testing meter (Keto-Mojo). At 2 weeks, SC-, WD-, and KD-fed mice were injected intraperitoneal (i.p.) with lipopolysaccharide (LPS; 6 mg/kg) and (D) 25 hr post-injection (p.i.), blood glucose levels were measured as stated in (A). (E) Temperature loss and (F) survival were monitored every 2 hr for mice treated as in (C) followed by i.p. injection with LPS (10 mg/kg). Age-matched (20–21 weeks) female C57BL/6 mice were fed SC, WD, or KD for 2 weeks followed by i.p. injection with LPS (4.5 mg/kg). (G) Temperature loss and (H) survival were monitored every 2 hr. For (A, B, D), all experiments were run three times, and data are representative of one experiment, n=5–8 mice/group. For (C, E, F), all experiments were run three times, and data are representative of one experiment, n=5–8 mice/group. For (G, H), data are representative of one experiment, n=10 mice/group. For (A–C, E, G), a Mann-Whitney U test was used for pairwise comparisons. For (F, H), a log-rank Mantel-Cox test was used for survival curve comparison. For (E), β symbols indicate SC +Veh vs. SC + BD significance, symbols indicate SC + Veh vs. KD significance, and δ symbols indicate SC + BD vs. KD significance. For (G), ϕ symbols indicate SC vs. WD significance, and symbols indicate SC vs. KD significance. For all panels, * p<0.05; ** p<0.01; *** p<0.001; **** p<0.0001. Error bars show mean ± SD.
Figure 1—figure supplement 1—source data 1. Data for graphs depicted in Figure 1—figure supplement 1A-H.