. 2022 Oct 20;11:e76744. doi: 10.7554/eLife.76744

Figure 2. Ketogenic diet (KD) feeding alters HSC populations and bone marrow-derived macrophages (BMDMs) from KD-fed mice show a hyper-inflammatory response to lipopolysaccharide (LPS) ex vivo.

Bone marrow was extracted from the femurs and tibias of age-matched (6–8 weeks) female BALB/c mice fed standard chow (SC), Western diet (WD), or KD for 2 weeks. (A) Fluorescence-Activated Cell Sorting (FACS) plots of total HSCs (CD201+CD27+) and (B) LT-HSCs, ST-HSCs, and multipotent progenitors (MPPs) from mice fed SC, WD, or KD for 2 weeks. Quantification of (C) the total numbers of LT- and ST-HSCs, and MPPs in bone marrow from mice fed SC, WD, or KD for 2 weeks. Next, BMDMs were plated at 5×10^6 cells/mL and differentiated for 7 days in media supplemented with macrophage colony-stimulating factor. Cells were split and plated in 24-well plates to adhere for 12 hr and treated with media (Ctrl) or LPS (24 hr; 10 ng/mL). Supernatants were assessed via ELISA for (D) TNF and (E) IL-6 secretion at 24 hr post-LPS treatment. IL-6 Ctrl supernatants were below the limit of detection; ND = no data. For (A-E), all experiments were run three times, and data are representative of one experiment, n=5 per diet group. (C) A Mann Whitney test was used for pairwise comparisons. (D, E) For all plates, all treatments were performed in triplicate, and a student’s t-test was used for statistical significance. *, p<0.05; **, p<0.01; ***, p<0.001; ****, p<0.0001. Error bars show the mean ± SD.

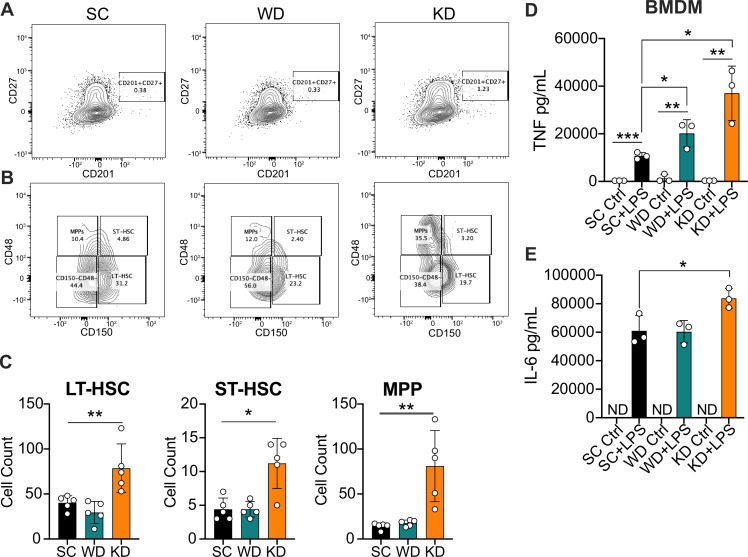
Figure 2—source data 1. Data and statistics for graphs depicted in Figure 2A–E.

Figure 2.

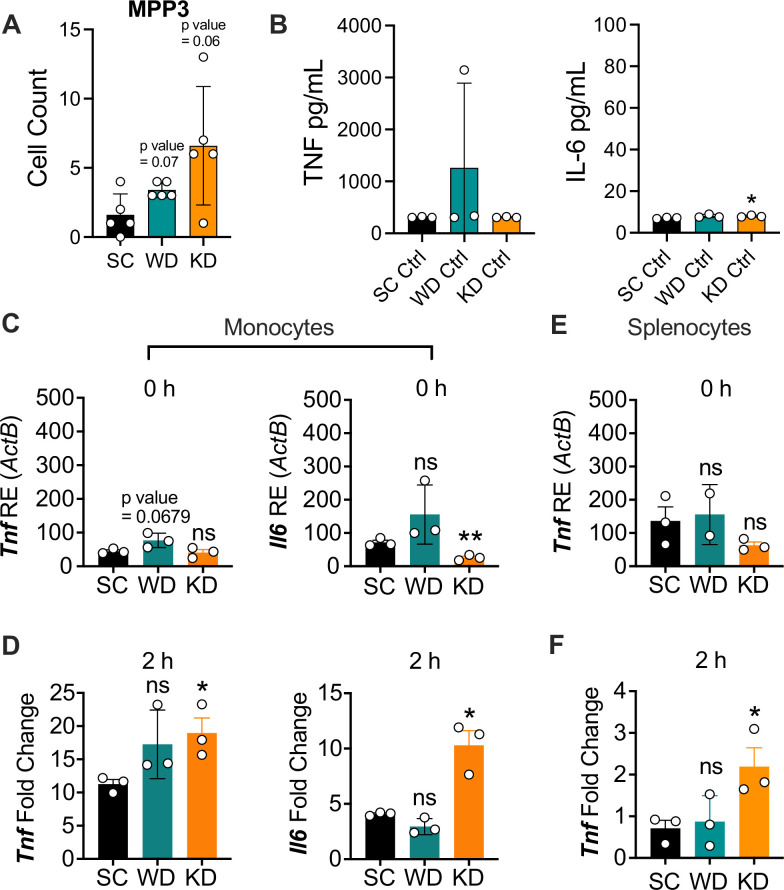
Figure 2—figure supplement 1. Ketogenic diet (KD) does not alter multipotent progenitor (MPP) differentiation or basal inflammation in bone marrow-derived macrophages (BMDMs), and monocytes and splenocytes show a hyper-inflammatory response to lipopolysaccharide (LPS) ex vivo.

Figure 2—figure supplement 1.

Age-matched (6–8 weeks) conventional, wild-type, female BALB/c mice were fed standard chow (SC), Western diet (WD), or KD for 2 weeks. Bone marrow was extracted from the femurs and tibias of mice, HSCs were isolated via FACS, and (A) MPPs were quantified. BMDMs were plated at 5×10⁶ cells/mL and differentiated for 7 days in media supplemented with macrophage colony-stimulating factor. Cells were split and plated in 24-well plates to adhere for 12 hr and treated with media (Ctrl) for 24 hr. Supernatants were assessed via ELISA for (B) TNF and IL-6 secretion. Monocytes were isolated from the femurs and tibias of mice and plated at 2×10⁶ cells/mL. RNA was extracted from (C) untreated monocytes (0 hr) or (D) monocytes with LPS (10 ng/mL) for 2 hr. Expression of Tnf and Il6 was analyzed via qRT-PCR. Splenocytes were isolated and plated at 1×10⁶ cells/mL. RNA was isolated from (E) untreated splenocytes (0 hr) or (F) splenocytes treated with LPS (10 ng/mL) for 2 hr. Expression of Tnf and Il6 was analyzed via qRT-PCR. For (A, B), all experiments were run three times, and data are representative of one experiment, n=5 per diet group. For (C-F), all experiments were run twice, and data are representative of one experiment, n=3 per diet group.(A) A Mann Whitney test was used for pairwise comparisons. (B-F) For all plates, all treatments were performed in triplicate, and a student’s t-test was used for statistical significance. For all panels, * p<0.05; ** p<0.01; *** p<0.001; **** p<0.0001. Error bars show mean ± SD.
Figure 2—figure supplement 1—source data 1. Data for graphs depicted in Figure 2—figure supplement 1.
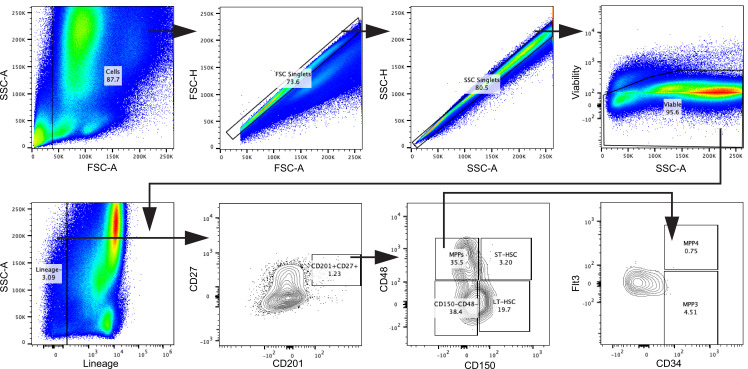
Figure 2—figure supplement 2. Gating strategy for HSCs, related to Figure 2.

Figure 2—figure supplement 2.

Cells were gated in FSC-A against SSC-A. Doublets were excluded using FSC-A against FSC-H and subsequently SSC-A against SSC-H. Viable cells were gated, and lineage-committed cells were excluded. Within the lineage-negative cells, the CD201+CD27+ population was gated. In a CD150 against CD48 plot, the CD201+CD27+ cells were divided into LT-HSC, ST-HSC, multipotent progenitor (MPP), and the remaining CD150CD48 population. MPPs were characterized as MPP3 and MPP4 by their surface expression of CD34 and Flt3.