. 2022 Oct 18;11:e77327. doi: 10.7554/eLife.77327

Figure 4. Dnajb6+/- mice exhibited increased incidence of SA and AVB and impaired response to autonomic stimuli.

(A) Schematics of the Dnajb6 knockout (KO) mice. The insertion of Velocigene cassette ZEN-Ub1 created a deletion of 36,843 bp nucleotides spanning from the first to the last intron of the Dnajb6 gene at the Chromosome 5. The neomycin selection cassette was excised after crossed to a Cre expression line. (B) Representative DNA gel images of PCR genotyping for identifying WT (300 bp), Dnajb6+/- heterozygous (hets), and Dnajb6-/-homozygous (homo) mutant alleles . (C) Western blotting and quantification of DNAJB6 short (S) and long (L) protein expression in WT and Dnajb6 mutants. N=3 animal per group. (D) Shown are representative ECG recordings results showing SA and AVB phenotypes detected in the Dnajb6+/- mice at 6 months. (E) The Dnajb6+/- mice manifests impaired response to different autonomic stimuli. N=10–12 mice per group, unpaired student’s t-test. SA, sinus arrest. AVB, atrioventricular block.

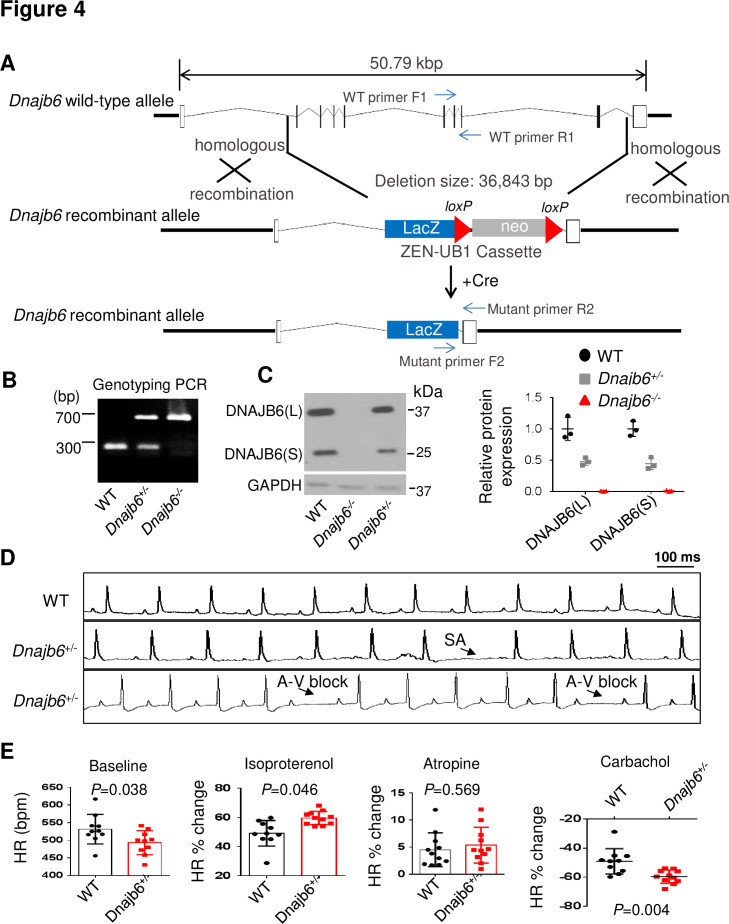
Figure 4—source data 1. Uncropped DNA gel image of PCR genotyping for identifying WT and DNAJB6 mutant mouse alleles (in PPT format).
Figure 4—source data 2. Uncropped Western blot to show expression levels of DNAJB6 short (S) and long (L) proteins in WT and DNAJB6 mutants (in JPG format).
Figure 4—source data 3. Uncropped Western blot to show expression levels of DNAJB6 short (S) and long (L) proteins in WT and DNAJB6 mutants (in PPT format).
Figure 4—source data 4. Uncropped Western blot to show expression levels of DNAJB6 short (S) and long (L) proteins in WT and DNAJB6 mutants (in JPG format).

Figure 4.

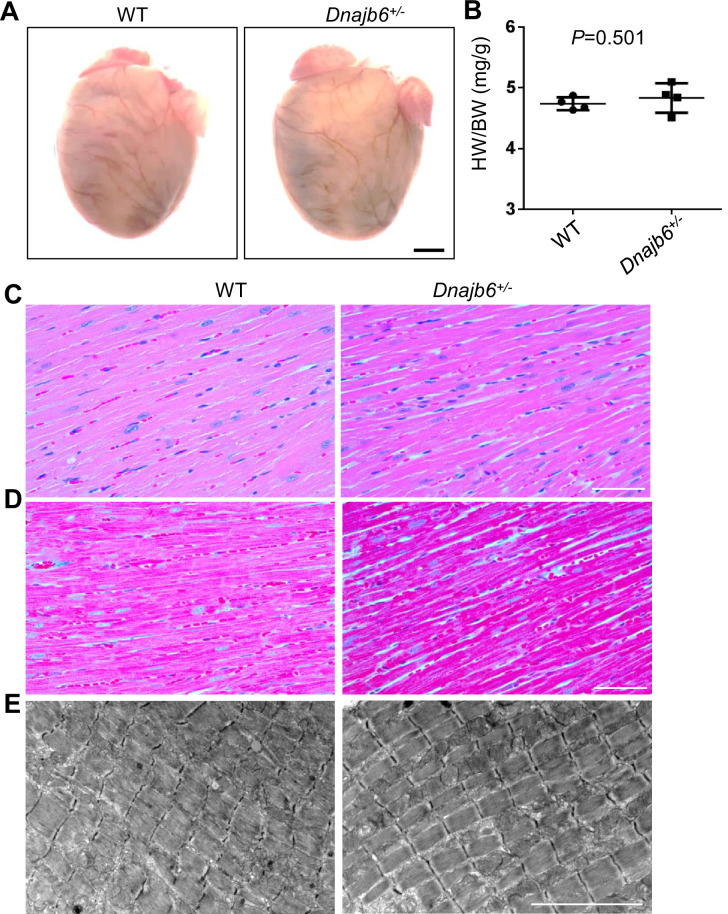
Figure 4—figure supplement 1. No abnormal myocardium structural remodeling was detected In the Dnajb6+/- mice.

Figure 4—figure supplement 1.

(A) Heart morphology of Dnajb6+/- mice compared to WT control at 1 year of age. (B) Quantification analysis of heart weight normalized by body weight (HW/BW) of Dnajb6+/- mice compared to WT control at 1 year of age. N=4, unpaired student t test. (C–E) Shown are histology images of H&E staining (C), Masson’s Trichrome staining (D), and transmission electron microscope (E) indicating the myocardium structure of Dnajb6+/- mice appeared to be indistinguishable to that in WT control. Scale bars in A, 1 mm; In C, D, 100 µm; In E, 5 um.