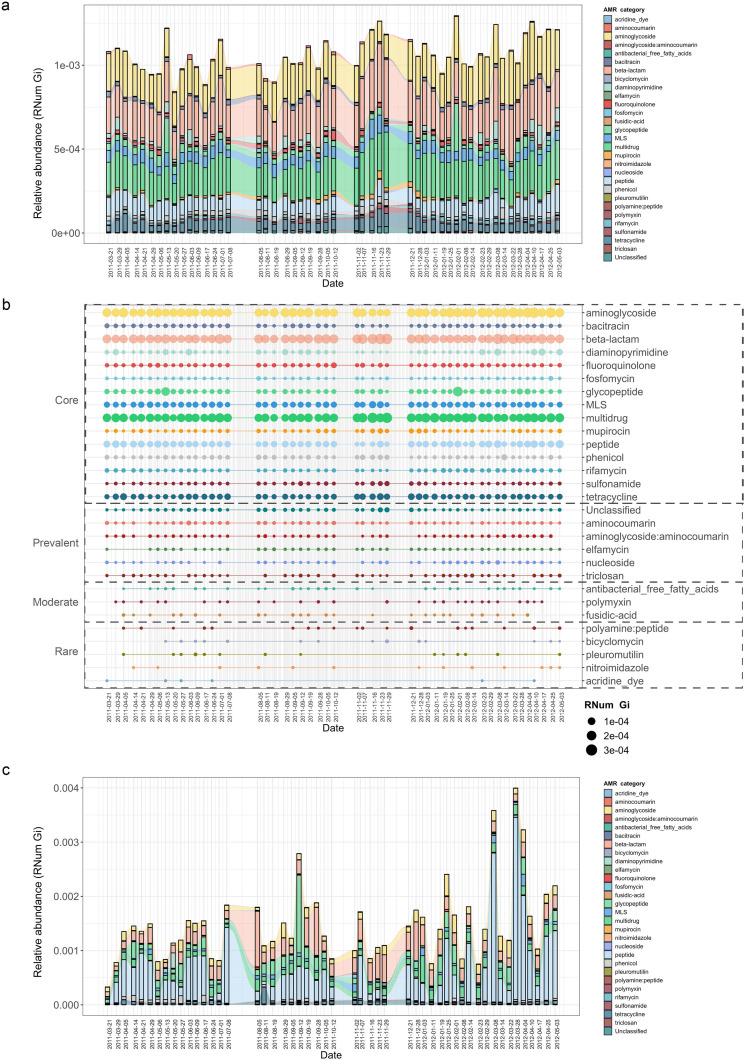
Figure 1. Longitudinal metagenomic and metatranscriptomic assessment of AMR.
(a) ARG relative abundances over time within the BWWTP. (b) AMR categories at various timepoints categorized in four distinct groups based on presence/absence: Core (all timepoints), Prevalent (>75% of timepoints), Moderate (50–75% of timepoints), and Rare (<50% of all timepoints). (c) Relative abundance levels of expressed AMR categories over time within the BWWTP. Colors of all panels correspond to the AMR categories.


