. 2022 Sep 16;11:e81196. doi: 10.7554/eLife.81196

Figure 2. Microbial population-linked AMR.

(a) Longitudinal ARG relative abundance levels linked to their corresponding microbial taxa (order level). Colors correspond to AMR categories. (b) Relative abundance of AMR categories linked to Candidatus Microthrix parvicella with colors corresponding to AMR categories. (c) Association network depicting co-occurrence patterns of individual antimicrobial resistance genes (ARGs) and microbial taxa on genus level. Nodes represent taxa or ARG with the node size representing the number of edges. The size of the edges represent the strength of interaction between the nodes.

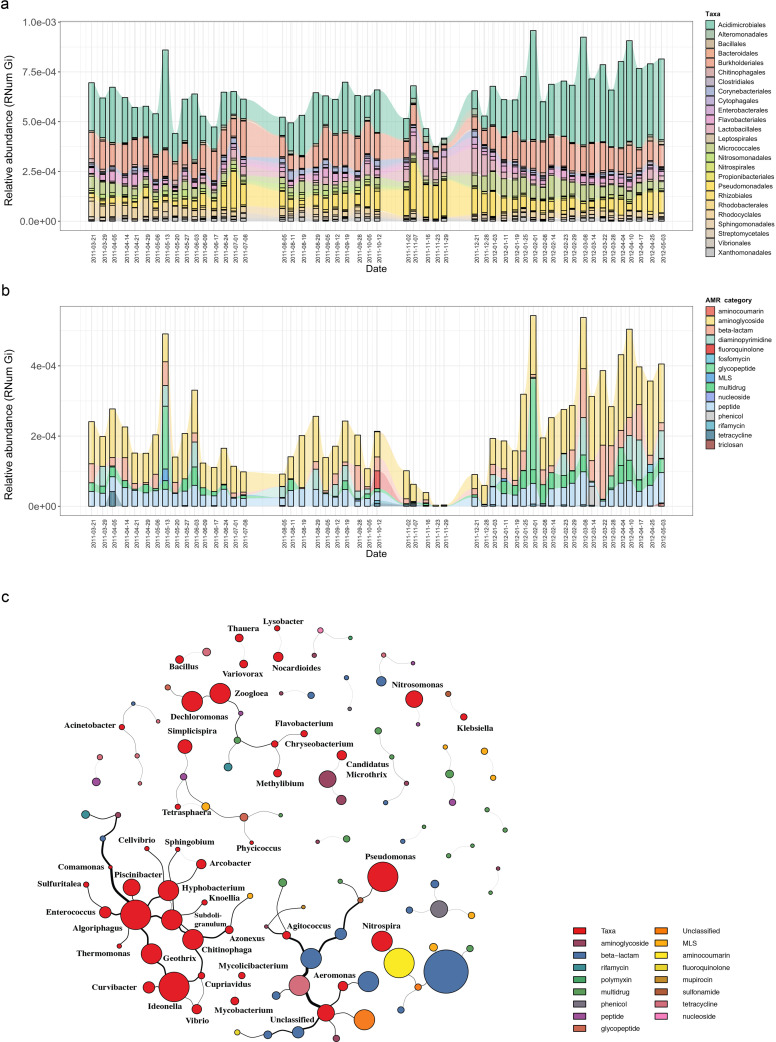
Figure 2.

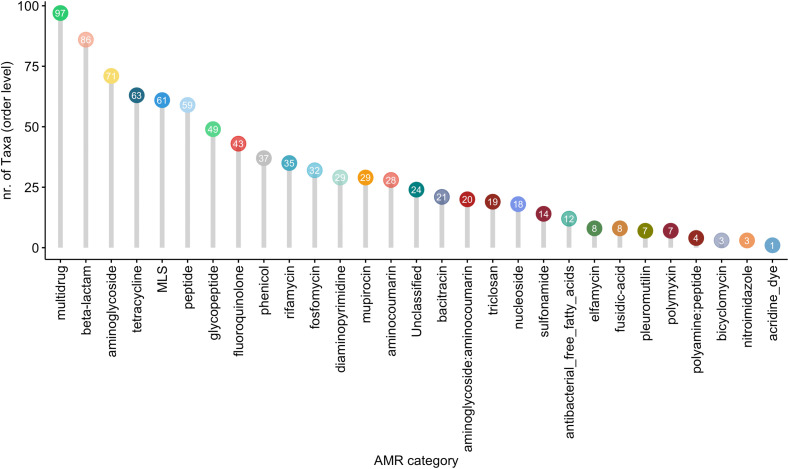
Figure 2—figure supplement 1. Taxonomic diversity of AMR.

Figure 2—figure supplement 1.

The plot indicates the number of taxa (order level) in which the corresponding AMR categories are identified. Numbers of taxa are highlighted at the top of each bar, with colors corresponding to the AMR categories, as visualized by the same colors in all figures, on the x-axis.
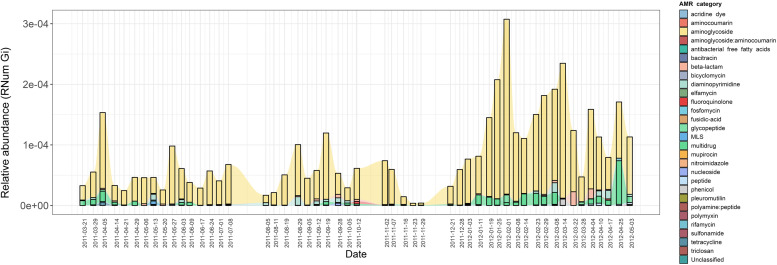
Figure 2—figure supplement 2. Expressed AMR categories of Candidatus Microthrix parvicella.

Figure 2—figure supplement 2.

Expression levels of AMR categories linked to Candidatus Microthrix parvicella over time. Colors correspond to the AMR categories.