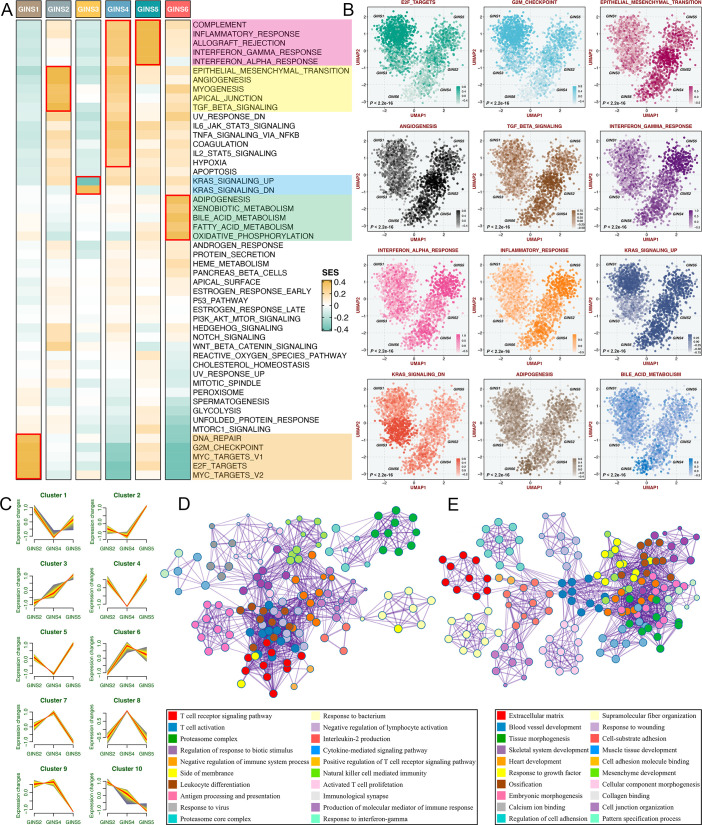
Figure 5. Biological peculiarities of six subtypes.
(A) SSEA-based analysis delineated the biological attributes inherent to GINS subtypes. (B) GSVA further estimated differences in pathway activity across six subtypes. Anova test. (C) Ten gene clusters were obtained via the soft clustering method (Mfuzz) in GINS2/4/5. (D–E) Enrichment analysis of gene cluster 3 (D) and 10 (E).
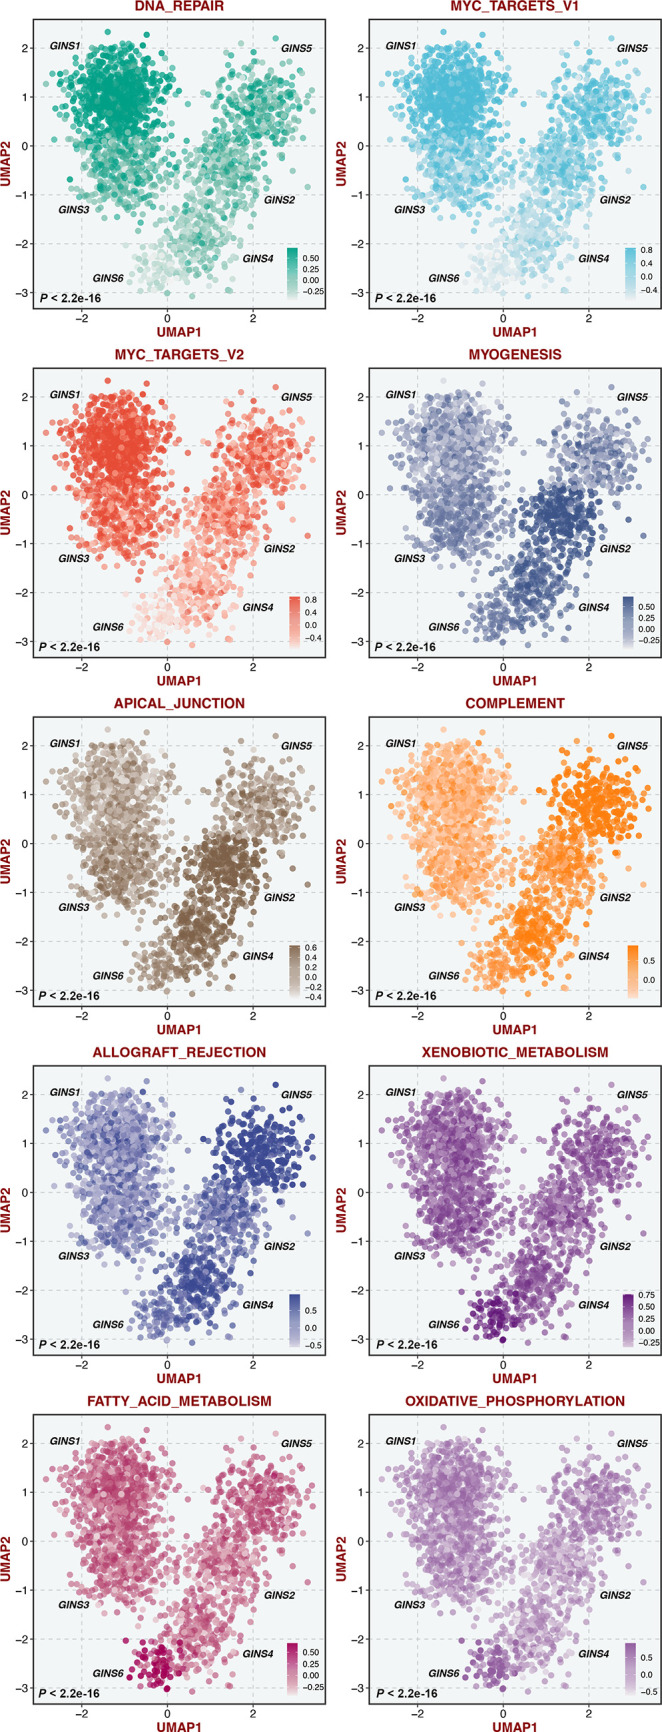
Figure 5—figure supplement 1. GSVA estimated differences in pathway activity across six subtypes.


