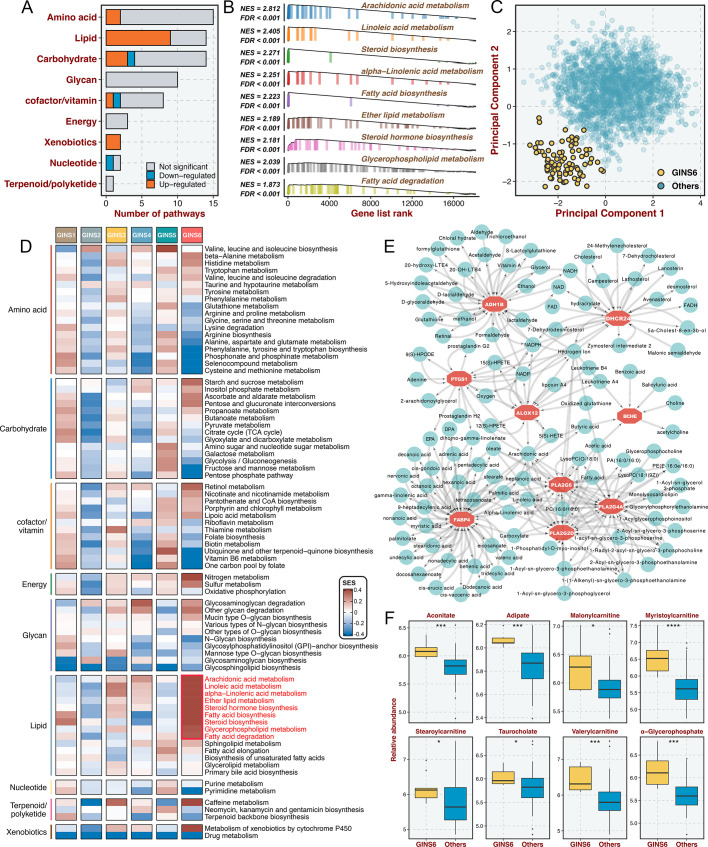
Figure 7. GINS6 tumors conveyed rich lipid metabolisms.
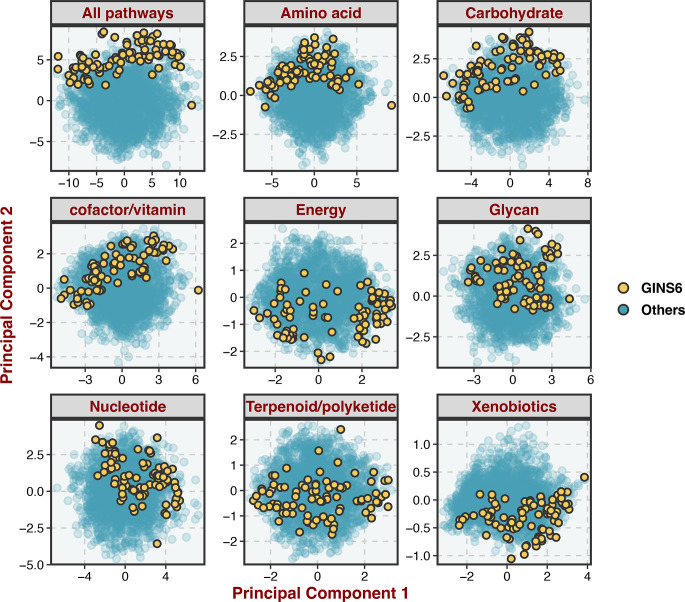
(A) The number of metabolic pathways that was significantly upregulated or downregulated (FDR <0.05) in GINS6 versus the other subtypes among each of nine metabolic categories. (B) GSEA plots of nine lipid metabolism pathways (FDR <0.001). (C) Principal component analysis of all samples in the discovery cohort for the mRNA expression of lipid metabolic genes. (D) SSEA-based framework further confirmed that GINS6 predominantly enriched high-ranking samples with stronger lipid signature scores. (E) Metabolite-protein interaction network (MPIN) was established via nine GINS6-specific genes with broad and tight connections with lipid metabolites. (F) Metabolomics results further demonstrated that GINS6 featured by abundant fatty acids metabolites. Wilcoxon test. *p<0.05, ***p<0.001, ****p<0.0001.


