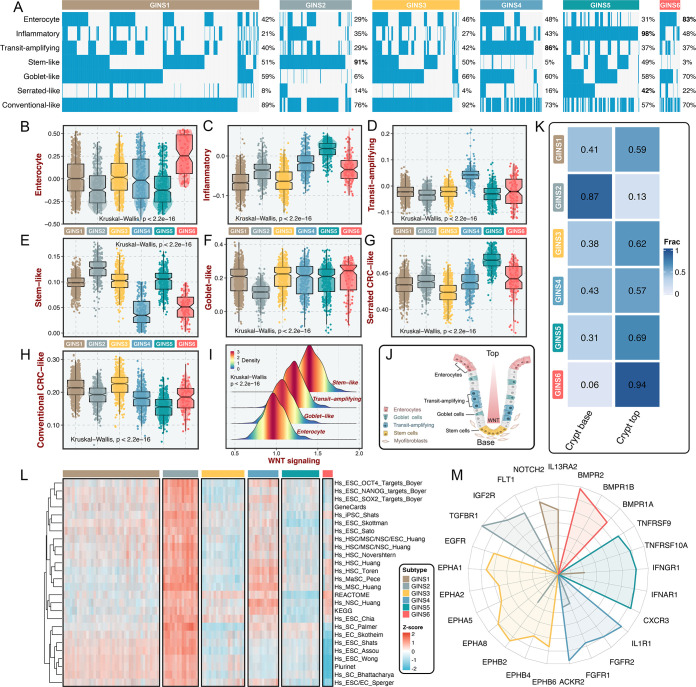
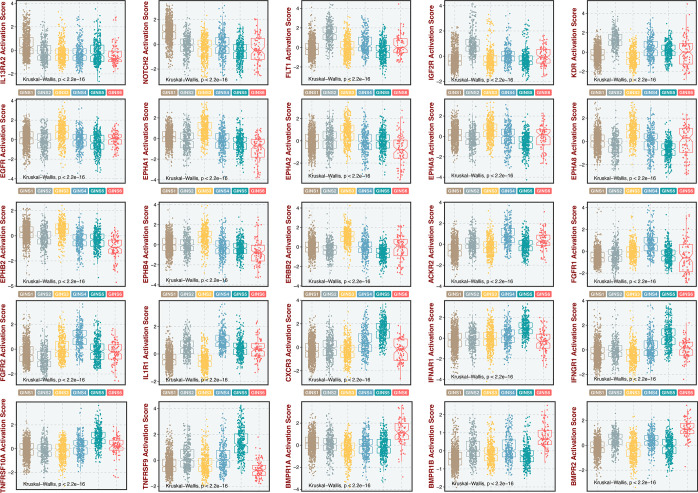
Figure 8. GINS subtypes were associated with cellular phenotypes and autocrine loops.
(A) Supervised approach identified phenotype origins peculiar to individual GINS classes. (B–H) Unsupervised-based GSVA showed the distribution of enterocyte (B), inflammatory (C), transit-amplifying (D), stem-like (E), goblet-like (F), serrated CRC-like (G), conventional CRC-like (H) scores among six subtypes. Kruskal-Wallis test. (I) The distribution of WNT signaling score in different cell-like tumors. Kruskal-Wallis test. (J) CRC cellular phenotypes correlated with colon-crypt location and WNT signaling. (K) Fractions of the crypt base and top phenotypes among six subtypes. Nearest template prediction (NTP) algorithm based on published signatures assigned each sample into the crypt base and top phenotypes in the discovery cohort. (L) GSVA analysis revealed that GINS2 displayed superior stemness abundance relative to other subtypes. (M) Radar plot showed autocrine stimulation loops in GINS subtypes.


