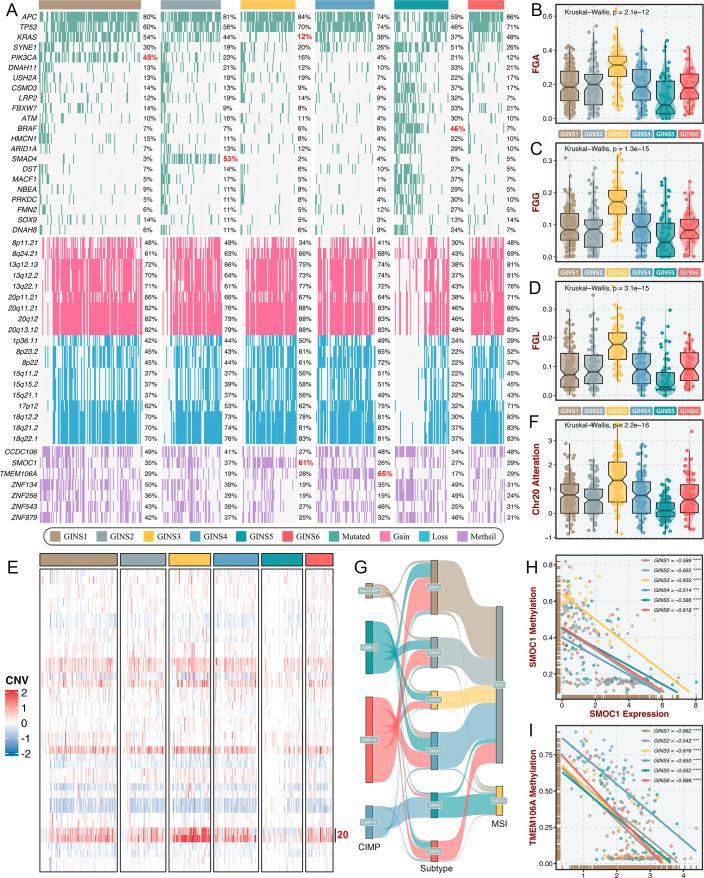
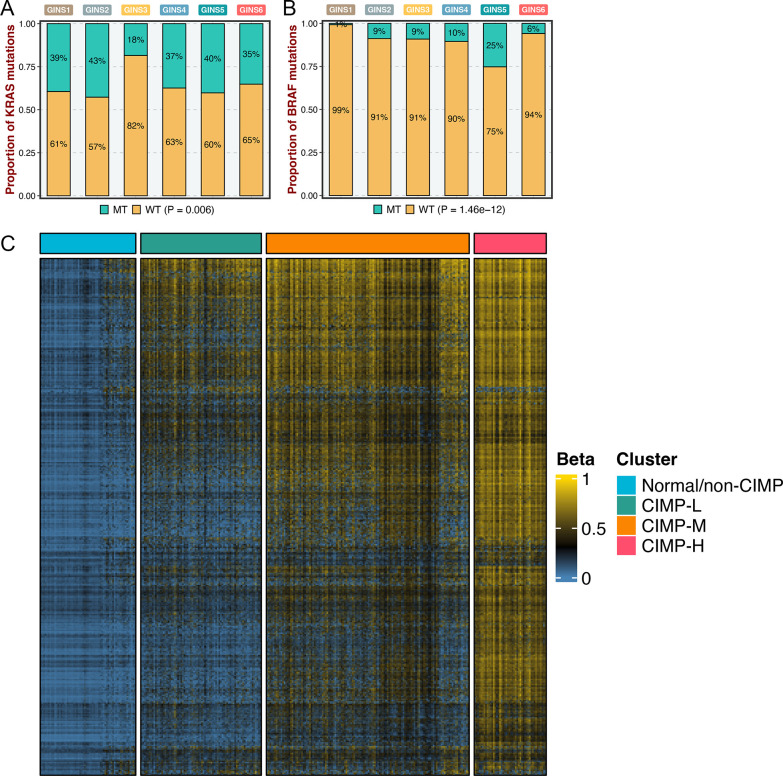
Figure 9. Multi-omics alteration characteristics of six subtypes.
(A) Genomic alteration landscape according to GINS taxonomy. The mutational genes were selected based on mutation frequency >10% and MutSigCV q-value <0.05. The focal gain and loss regions were selected based on CNV frequency >40% and GISTIC q-value <0.05. The methylation silencing (Methsil) genes were identified based on our pipeline. (B–D) The distribution of fraction of genome alteration (FGA), fraction of genome gained (FGG), and fraction of genome lost (FGL) among six subtypes. Kruskal-Wallis test. (E) Heatmap showed the distribution of broad copy number changes across six subtypes in the TCGA-CRC dataset. (F) The distribution of Ch20 alterations in six subtypes. Kruskal-Wallis test. (G) Sankey plot showed connections among GINS subtypes, CIMP phenotypes, and MSI phenotypes. (H–I) The expression levels of SMOC1 and TMEM106A were significantly inversely correlated with their methylation levels. ***p<0.001, ****p<0.0001.


