
FIGURE 6.
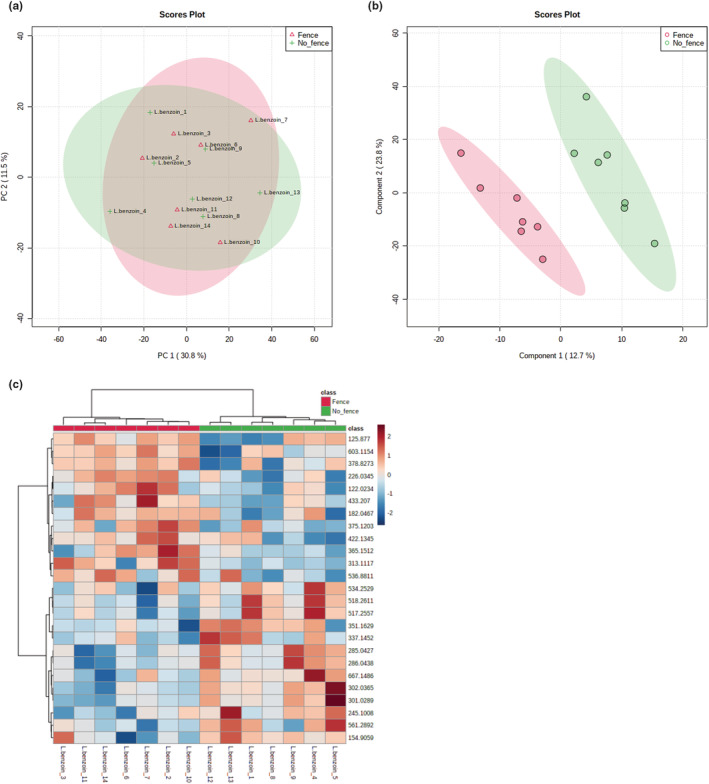
Untargeted metabolomic analysis of fenced and unfenced Lindera benzoin samples. (a) Principal component analysis (PCA) of all metabolite features did not group the samples into two clusters that correspond with the fencing treatment. (b) Partial least squares discriminant analysis (PLS‐DA) identified the top 15 metabolites that accumulated significantly differently among the fencing treatments and grouped the samples based on those metabolites, showing separation of the samples into distinct groups based on treatment. (c) Hierarchical cluster analysis (HCA) computed based on the top 25 statistically significantly different metabolite features grouped the samples into two fencing treatment‐based groups. The relative concentration of each metabolite is indicated by the color scale, and the relationship among the samples is indicated by the color‐coded dendrogram on the top of the HCA plot.