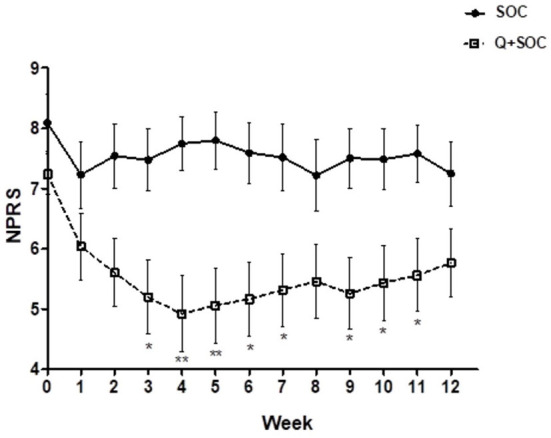
Figure 3.

Time–course graph of spontaneous pain scores over 12 weeks in the two study groups, capsaicin 8% patch Qutenza (Q) plus Standard of Care group (PDPN Q+SOC; n = 25), and Standard of Care group (PDPN SOC alone; n = 12). Separate assessment of pain scores at each week time point showed a significant difference in NPRS scores at week 3 (*p < 0.05), week 4 (**p < 0.05), week 5 (*p < 0.05), week 6 (*p < 0.05) and week 9 (*p < 0.05; two–way ANOVA analysis).
