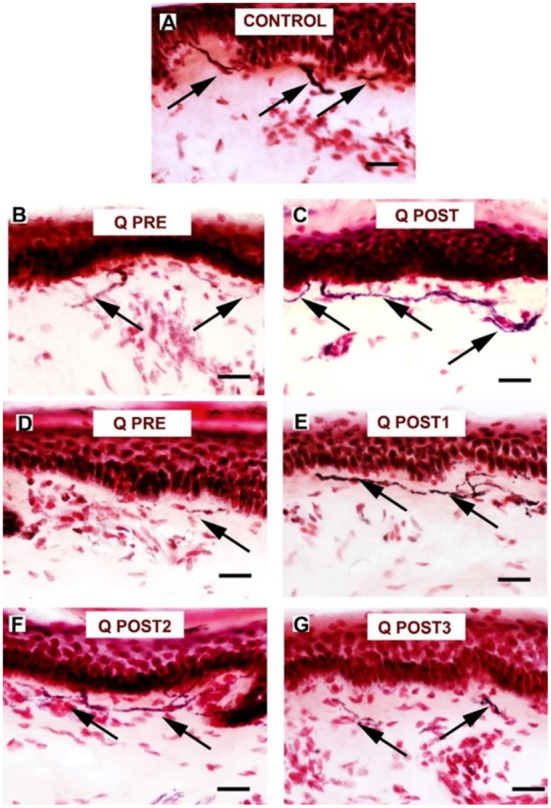
Figure 9.

Staining for GAP 43 in control skin, NPDPN Q+SOC and PDPN Q+SOC before and after application of Capsaicin 8% patch Qutenza (Q) (treatment Control skin biopsy section, from a healthy human volunteer (sub–epidermal nerve fiber with arrow). (A) Control skin biopsy section, from a healthy human volunteer (sub–epidermal nerve fibers marked with arrows). (B)Skin biopsy section from a participant with NPDPN Q+SOC pre–treatment (Q PRE). (C) Same participant as above 3 months post–treatment (Q POST); Note the abundance and length of SENFs which appeared increased. (D) A participant with PDPN Q+SOC pre–treatment before treatment (Q PRE). (E) Same participant as above 3 months post–treatment (Q POST1); Note the abundance and length of SENFs which appeared increased. (F,G) Same PDPN Q+SOC participant 6 months post treatment (Q POST2) and 9 months post treatment (Q POST3), note return to control level at 9 months. (Scale bar 50 μm, Magnification x40).
