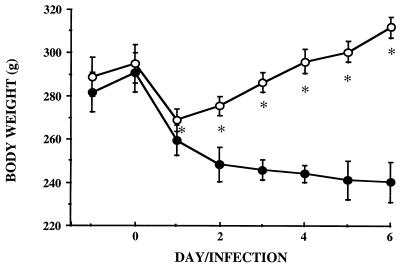
FIG. 5.
Body weight changes after an i.v. injection of live or dead bacteria (experiment 5). Rats received an i.v. injection of 7 × 10⁸ live E. coli (●) or the same amount of bacteria heated for 30 min at 60°C (○). Data are means ± standard deviations (n = 6). ∗, P < 0.05 versus the group injected with live bacteria.

