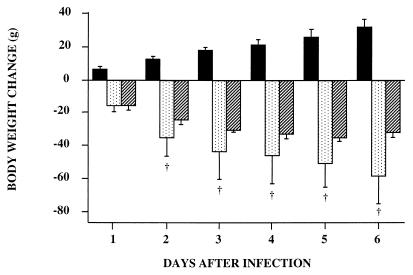
FIG. 6.
Effect of infection on body weight change (experiment
6). ■, control rats given an i.v. injection of saline and free access
to food;
, infected rats given an i.v. injection of E.
coli ([8.3 ± 0.8] × 108) and free access to
food;  , PF
counterparts of infected rats given an i.v. injection of saline. All
measurements were performed over the 6 days following injection of
bacteria or saline. Data are means ± standard deviations. ∗,
P < 0.05 versus the PF group.

