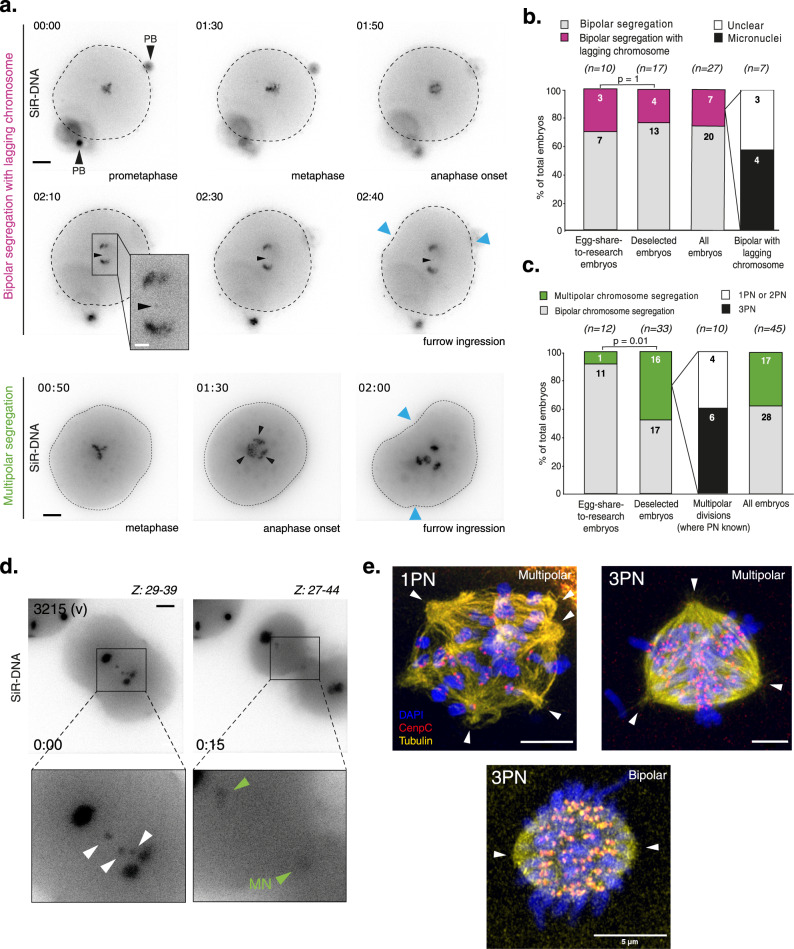
Fig. 2. The first mitosis in deselected human embryos is highly error prone, consistent with clinical-grade embryos.
a Top panel: Time lapse imaging of a deselected human embryo progressing through the first embryonic mitosis with a lagging chromosome (Embryo 3004iii). Bottom panel: Time lapse imaging of a deselected human embryo of unknown pronuclei status progressing through the first embryonic mitosis with multipolar chromosome segregation (Embryo 3034vii). Chromosomes are visualised using SiR-DNA dye. Z indicates slices shown as a maximum intensity projection. Time in hours:mins, scale bar 20 µm. Blue arrows indicate onset of cleavage furrow ingression. Black arrows indicate polar bodies. All deselected embryos were imaged using a widefield microscope. b Quantification of embryos undergoing the first embryonic mitosis with bipolar chromosome segregation. N numbers are shown within bars. The number of embryos in which micronuclei clearly formed around lagging chromosomes are shown in the fourth bar. P value from a two-sided Fisher’s exact test. c Quantification of embryos undergoing bipolar or multipolar divisions in the first embryonic mitosis. N numbers are shown within bars. As deselected embryos can have varying numbers of pronuclei, this was detailed for embryos dividing with multipolar chromosome segregation (third bar). All egg-share-to-research embryos contain 2 pronuclei. P value from a two-sided Fishers exact test. d Time lapse imaging of a deselected human embryo progressing through the first embryonic mitosis in the presence of lagging chromosomes (white arrows), around which micronuclei form (green arrows). Chromosomes are visualised using SiR-DNA dye. Z indicates slices shown as a maximum intensity projection, time in hours:mins, scale bar 20 µm. (Embryo 3215 v). e Airyscan super-resolution confocal microscopy images of 1PN and 3PN human embryos fixed during the first mitotic division and stained with DAPI, CenpC and tubulin antibodies. White arrows indicate perceived MTOCS/spindle poles. Scale bar 5 µm. Source data are provided as a Source data file.

