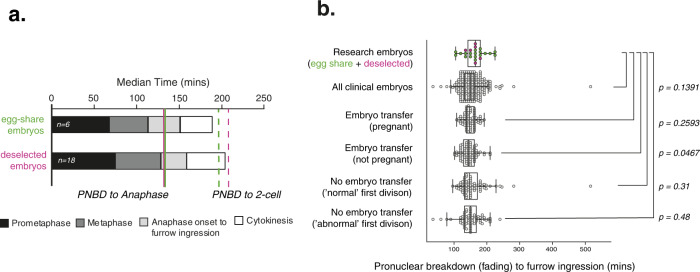
Fig. 4. Deselected embryos have similar mitotic timing to clinical embryos.
a Median durations of each mitotic phase plotted consecutively from 6 complete egg-share embryos movies and 18 deselected embryo movies during the first mitosis. b Quantification of timing from PNBD or pronuclear fading to furrow ingression (start of cytokinesis) for complete movies of research embryos (deselected (pink) and egg-share (green), n = 24) and clinical embryos (imaged using EmbryoScope during patient treatment, grey background, n = 304). Box and whisker plots represent minimum, lower quartile, median, upper quartile and maximum. Outliers fall beyond these lines. Individual data points are overlaid. Clinical embryos fall into four categories: singly transferred embryos which gave rise to clinical pregnancy, singly transferred embryos which did not give rise to clinical pregnancy, non-transferred embryos which divided normally into 2 cells, and non-transferred embryos which divided into 3 or more cells in the first division. 95% confidence intervals (bottom–top, min): Research 149.61–176.63, All embryos 146.57–154.38, transferred pregnant 144.14–152.4, Transferred not pregnant 139.86–150.19, Non-transferred normal first division 146.06–169.24, Non-transferred abnormal 142.55–158.86. Whole data P value from the Kruskal–Wallis test is 0.1151. Pairwise P values from Kruskal–Wallis test with post hoc Dunn’s test. Source data are provided as a Source data file.

