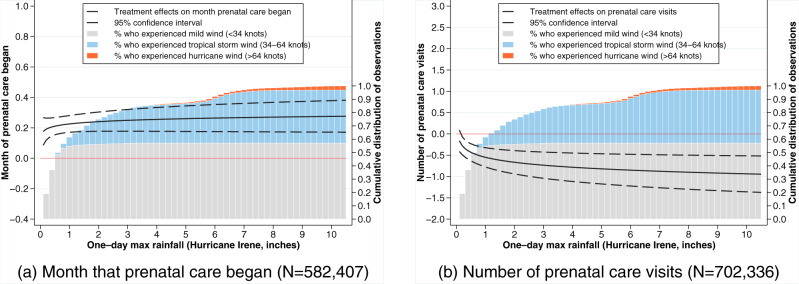
Fig. 2. Estimated treatment effect of Hurricane Irene exposure on the month that prenatal care began and the number of prenatal care visits.
The treatment effects measured for prenatal care indicators including: a The month that prenatal care began and b the total number of prenatal care visits. Rainfall at residential address was used as an indicator of exposure intensity represented by the one-day maximum rainfall from August 14, 2011 to September 4, 2011, which encompassed the hurricane event’s impact on North Carolina. Estimated treatment effects were overlayed with a cumulative distribution of wind speed exposures. Rainfall source: Parameter-elevation Regressions on Independent Slopes Model (PRISM) climate group Time Series Values for Individual Locations. Source data are provided as a Source Data file.

