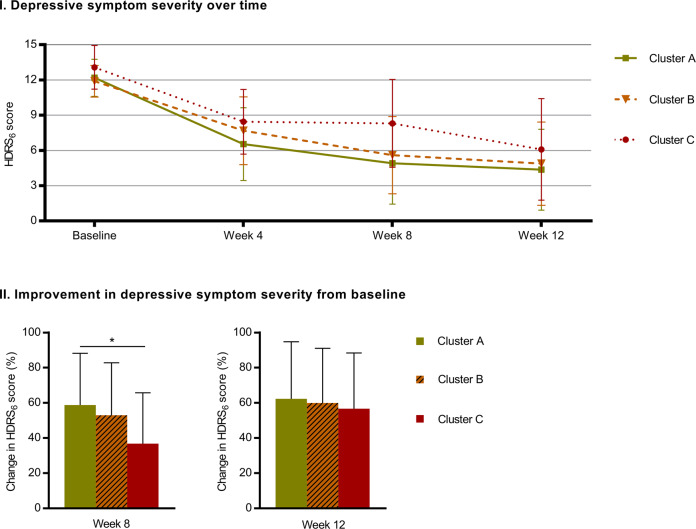
Fig. 1. Change in depressive symptom severity over time for cognitive profile clusters.
Panel I shows Hamilton Depressive Rating Scale 6 (HDRS6) scores for each of the three cognitive profile clusters at baseline, week 4, week 8, and week 12. Panel II shows improvement (i.e., reduction) in HDRS6 scores in percentage for the three cognitive profile clusters at week 8 and week 12 relative to baseline. The graphs show observed group averages and the error bars denote standard deviations while the significance notation in panel II represents model estimates corrected for age and sex. * p < 0.05.

