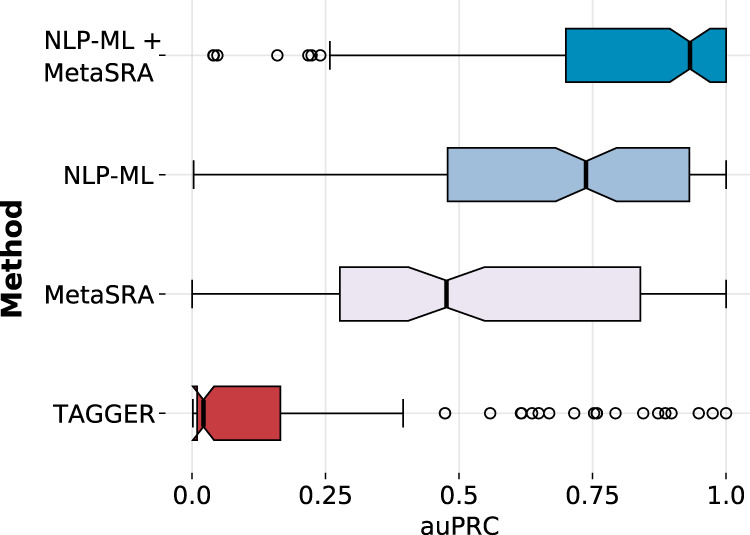
Fig. 2. NLP-ML outperforms other text-based methods for sample tissue classification.

Distribution of the area under the precision-recall curve (auPRC) scores across 153 tissues for each of the three individual text-based methods for sample classification: TAGGER, MetaSRA, and NLP-ML. Also shown is the distribution of auPRC scores for combining the predictions of NLP-ML and MetaSRA. Each point in the boxplot is the performance for a single-tissue model averaged across cross-validation folds. In each boxplot (in a different color), the bounds of the box correspond to the distribution’s first and third quartiles, the center line is the median, the whiskers extend to the farthest data point within 1.5 times the interquartile range from the bounds, and the separate dots are outliers. Source data are provided as a Source Data file.
