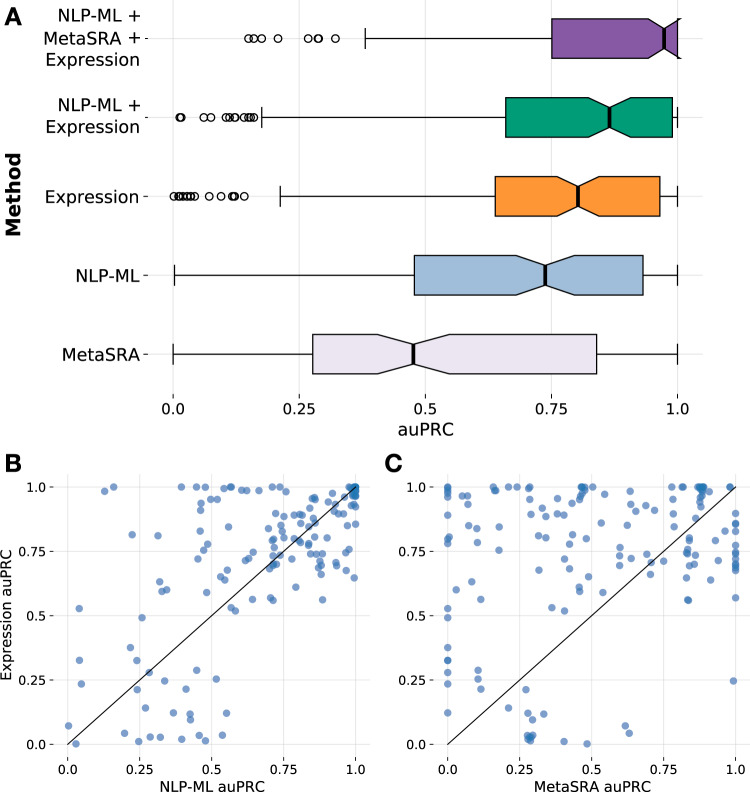
Fig. 6. NLP-ML models are nearly as accurate as expression-based models in predicting tissue source of transcriptome samples, and combining them is better than either.
A Distribution of the area under the precision-recall curve (auPRC) scores across 153 tissues for the two top-performing text-based methods—MetaSRA and NLP-ML—and for the method based on expression profiles (‘Expression’) for sample tissue classification. Also shown are the distributions of auPRC scores for combining the predictions of Expression with NLP-ML (‘NLP-ML + Expression’) and with NLP-ML and MetaSRA (‘NLP-ML + MetaSRA+Expression’). Each point in the boxplot (in a different color; defined as in Fig. 2) is the performance for a single-tissue model averaged across cross-validation folds. B Scatterplot of the area under the precision-recall curve (auPRC) scores of sample tissue predictions by NLP-ML models (x-axis) vs. predictions by expression-based models (y-axis). C Scatterplot similar to (and shares y-axis with) panel B but with auPRC scores of predictions by MetaSRA on the x-axis. Each point in the scatterplots correspond to a tissue/cell-type term. auPRC scores are averages across cross-validation folds. The solid line denotes equal performance between the two methods. Source data are provided as a Source Data file.

