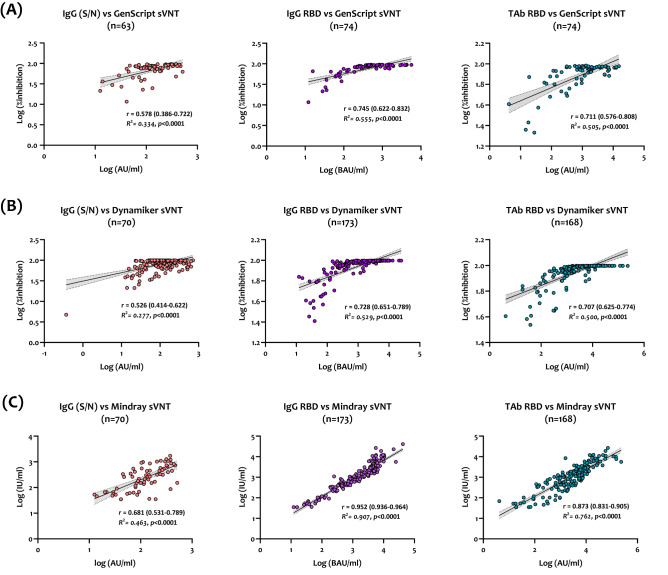
Figure 3.
Correlation and linear regression analysis between each sVNT and serological assays detecting anti-SARS-CoV-2 binding antibodies, including anti-S and N IgG antibodies (orange), anti-RBD IgG (violet), and anti-RBD total antibodies (turquoise) for samples collected from previously infected and vaccinated individuals. (A) GenScrip sVNT, (B) Dynamiker sVNT, (C) Mindray NTAb sVNT. Presented data show the log-transformed values of quantitative results obtained by each assay.

