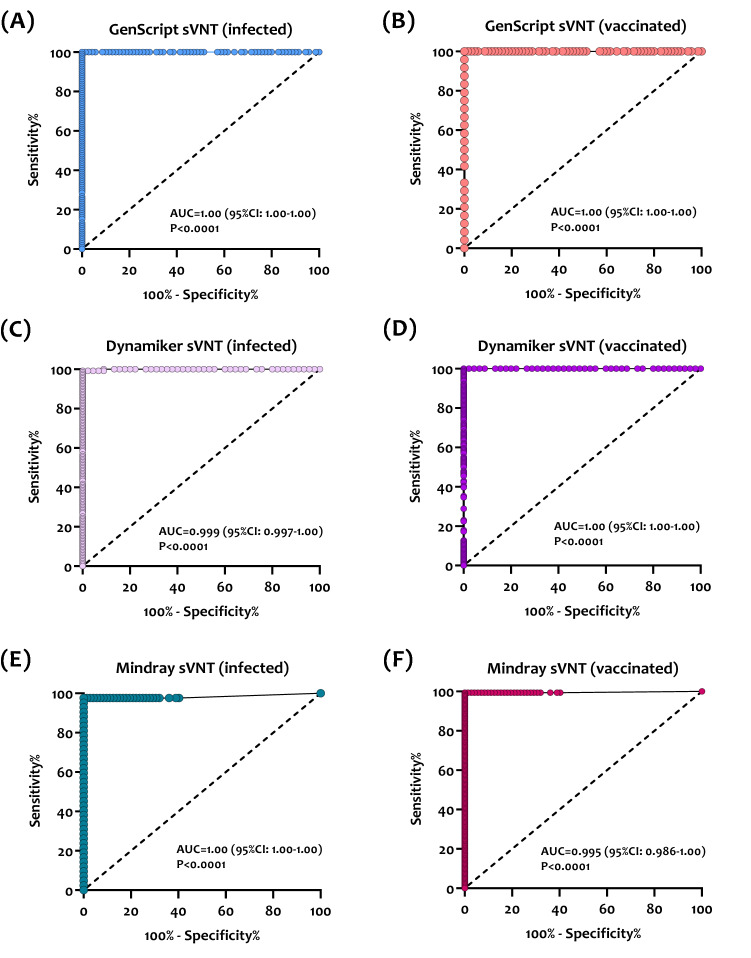
Figure 5.
Empirical receiving operating characteristic (ROC) curve analysis for estimating optimal thresholds for sVNT assays targeting nAbs against SARS-CoV-2. (A) GenScript sVNT ROC curve in SARS-CoV-2 infected patients (n = 105). (B) GenScript sVNT ROC curve in COVID-19 vaccinated individuals (n = 24). (C) Dynamiker sVNT ROC curve in SARS-CoV-2 infected patients (n = 127). (D) Dynamiker sVNT ROC curve in COVID-19 vaccinated individuals (n = 156). (E) Mindray sVNT ROC curve in SARS-CoV-2 infected patients (n = 52). (F) Mindray sVNT ROC curve in COVID-19 vaccinated individuals (n = 155). The sensitivity and specificity values correspond to the plotted points which were used to estimate the area under the curve (AUC) and p-value for each curve.

