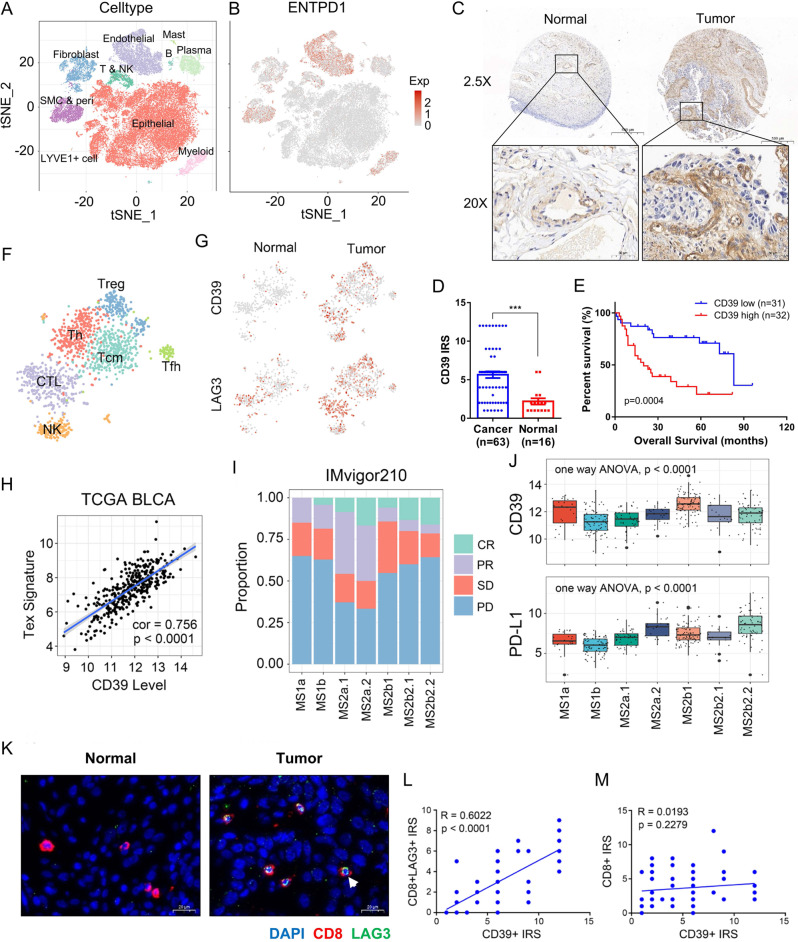
Fig. 1. Expression distribution and function of CD39.
A The single cells from 8 BC and 3 paracancer tissues were clustered into 10 major clusters. B The CD39 was mainly expressed in endothelial cells, smooth muscle cells, pericytes, myeloid cells, fibroblasts, and lymphocytes. C Immunohistochemical staining of CD39 in BC (n = 63) and paracancer (n = 16) tissues in a tissue array. Scale bars, 500 μm (upper) and 50 μm (lower). D The expression levels of CD39 staining in BC (Mean ± SEM: 5.651 ± 0.4354, n = 63) and paracancer (Mean ± SEM: 2.188 ± 0.4105, n = 16) tissues were assessed using Remmele and Stegner’s semiquantitative immunoreactive score (IRS) scale. The two-side unpaired Student’s t-test was used for two-group comparisons of values. E A high level of CD39 predicted poor prognosis in 63 BC patients. The log-rank (Mantel–Cox) test was used to compare the survival curves. F, G The differences in CD39 expression patterns between lymphocytes of BC (n = 8) and paracancer (n = 3) tissue origin, and the correlation between CD39 and LAG3. H Correlation between the CD39 expression level and T-cell exhaustion in the TCGA-BLCA cohort. A linear regression model (Pearson’s correlation) was used to determine the individual correlations between different variables. I, J Correlation between the clinical outcome of aPD-L1 agent (atezolizumab) and the expression level of PD-L1 or CD39 in 7 molecular types of BC patients reported by Mariathasan et al.21, MS1a: n = 23, MS1b: n = 79, MS2a1: n = 45, MS2a2: n = 25, MS2b1: n = 92, MS2b2.1: n = 18, MS2b2.2: n = 66. Bounds of the box spans from 25% percentile to 75% percentile, a dashed line shows median, and whiskers indicate minima and maxima. K Immunofluorescence staining (DAPI: blue, CD8: red, LAG3: green) of exhausted T cells in BC (n = 63) and paracancer (n = 16) tissues in a tissue array, Mean ± SEM of CD8 + LAG3 + IRS: 2.778 ± 0.2971, n = 63, Mean ± SEM of CD8 + IRS: 3.698 ± 0.3108, n = 63. Scale bars = 20 μm. L, M Correlation between the expression level of CD39 and the proportion of T-cell exhaustion (Mean ± SEM: 2.778 ± 0.2971, n = 63) or CD8 + T-cell infiltration (Mean ± SEM: 3.698 ± 0.3108, n = 63). A linear regression model (Pearson’s correlation) was used to determine the individual correlations between different variables. Source data are provided as a Source Data file (D, E, L, M). P-values <0.05 were considered significant: *P < 0.05; **P < 0.01; ***P < 0.001; ****P < 0.0001.

