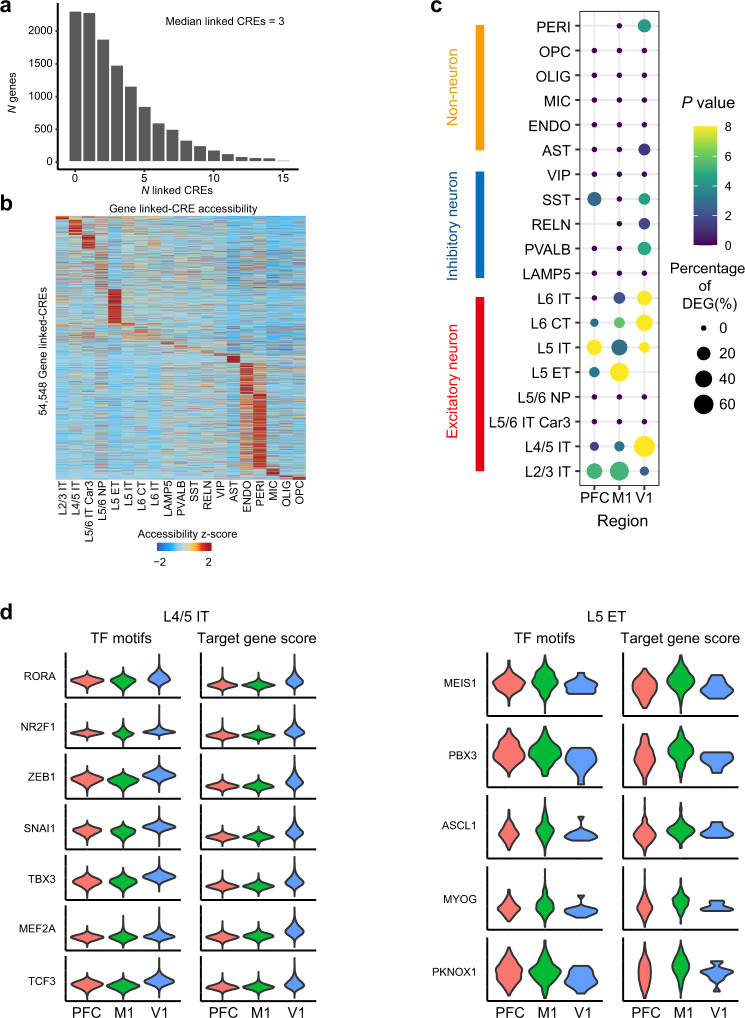
Fig. 2. Transcriptional regulation of the cell type-specific and area-specific gene expression (Source data are provided as a Source Data file).
a Histogram showing the number of genes that linked to cis-regulatory elements (CREs). b Heatmap showing row-normalized gene-linked CREs in each cell type of snATAC-seq cells. c Dot plots of overlapped genes between differentially accessible peaks (DA peaks)-targeted gene and the differentially expressed genes (DEGs) of each cortical area in neuronal and non-neuronal cell types. Dot size represents the percentage of overlap genes of area DEGs. A one-sided hypergeometric test was performed for gene set overlap significance. d Violin plots of motif enrichment and targeted gene score of selected TFs that had significant upregulated in V1 of snATAC-seq L4/5 IT type excitatory neuron (left) and in M1 of snATAC-seq L5 ET type excitatory neuron (right).

