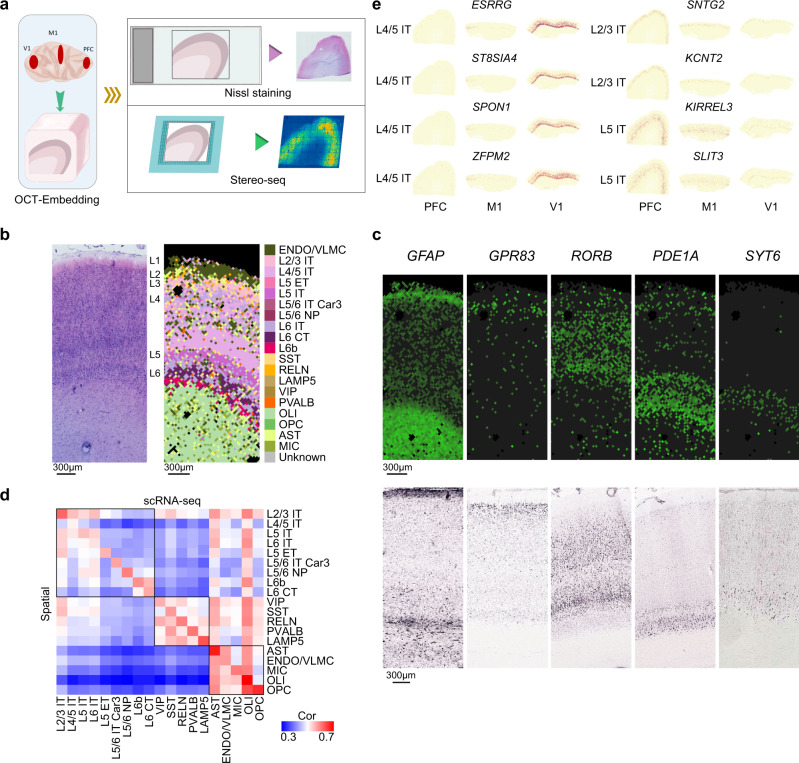
Fig. 4. Characterization of cortical gene expression by Stereo-seq (Source data are provided as a Source Data file).
a Schematic workflow of tissue sampling and Stereo-seq from the prefrontal cortex (PFC), primary motor cortex (M1) and primary visual cortex (V1). b Nissl staining of adjacent section to stereo-seq section of primary visual cortex (left), and cell type annotation for 37.5 μm bins of stereo-seq section of primary visual cortex by snRNA-seq data (right). c Representative micrographs of known layer-marker genes expression in the stereo-seq section of (b) (top), experiments have been performed independently in 2 slices, and RNA ISH images for corresponding layer markers in primary visual cortex of macaque brain from the NIH Blueprint Non-Human Primate (NHP) Atlas:1 GFAP (http://www.blueprintnhpatlas.org/ish/experiment/show/100140483), GPR83 (http://www.blueprintnhpatlas.org/ish/gene/show/183031), RORB (http://www.blueprintnhpatlas.org/ish/gene/show/183109), PDE1A (http://www.blueprintnhpatlas.org/ish/gene/show/183138) and SYT6 (http://www.blueprintnhpatlas.org/ish/experiment/show/100091672) (bottom). d Heatmap showing Spearman’s rank correlation between clusters identified in Stereo-seq versus snRNA-seq data. e Spatial expression maps of selected differentially expressed genes between PFC, M1 and V1 in EX subtypes.

