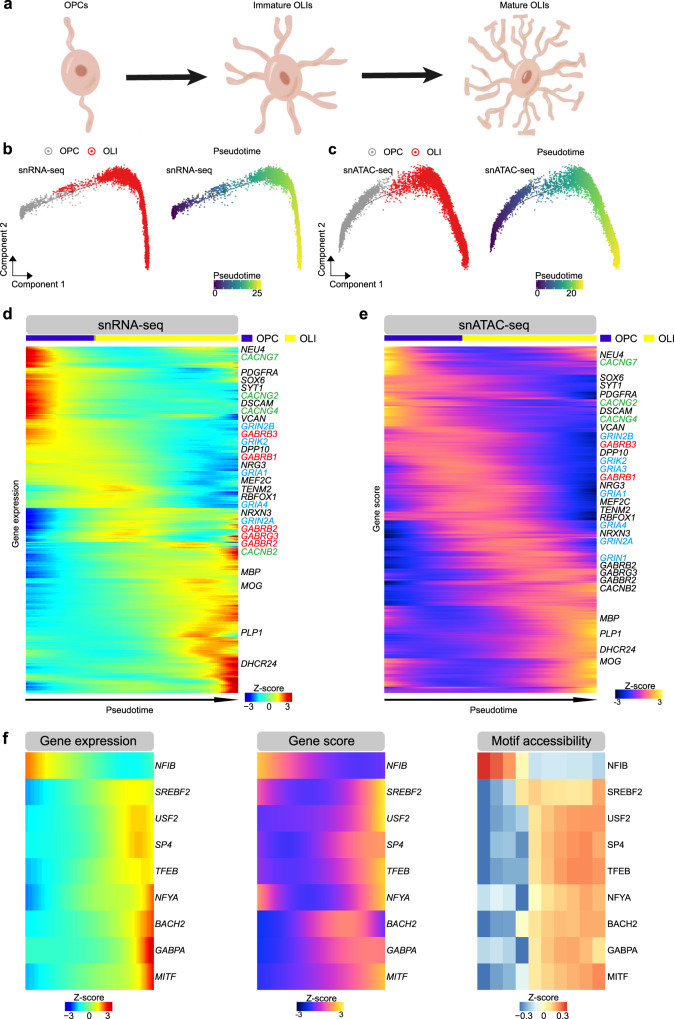
Fig. 5. Integrated single cell regulatory landscape of oligodendrocyte trajectory (Source data are provided as a Source Data file).
a Schematic illustration for oligodendrocyte maturation. b Pseudotime trajectory of OPC and OLI indicating the gene expression obtained from snRNA-seq data. c. Pseudotime trajectory of OPC and OLI indicating the gene activity score obtained from snATAC-seq data. d Heatmap showing genes expression dynamics across oligodendrocyte lineage pseudotime trajectory indicated in (b). Genes of glutamate receptors, gamma-aminobutyric acid (GABA) receptors and voltage-gated calcium channel (VGCCs) were blue, red, and green color-coded, respectively. e Heatmap showing accessibility dynamics (gene activity score) across oligodendrocyte lineage pseudotime trajectory in (c). Genes of glutamate receptors, gamma-aminobutyric acid (GABA) receptors and voltage-gated calcium channel (VGCCs) were blue, red, and green color coded, respectively. f Gene expression (left), gene activity score (middle) and motif enrichment (right) of 9 TFs across OLI pseudotime trajectory.

