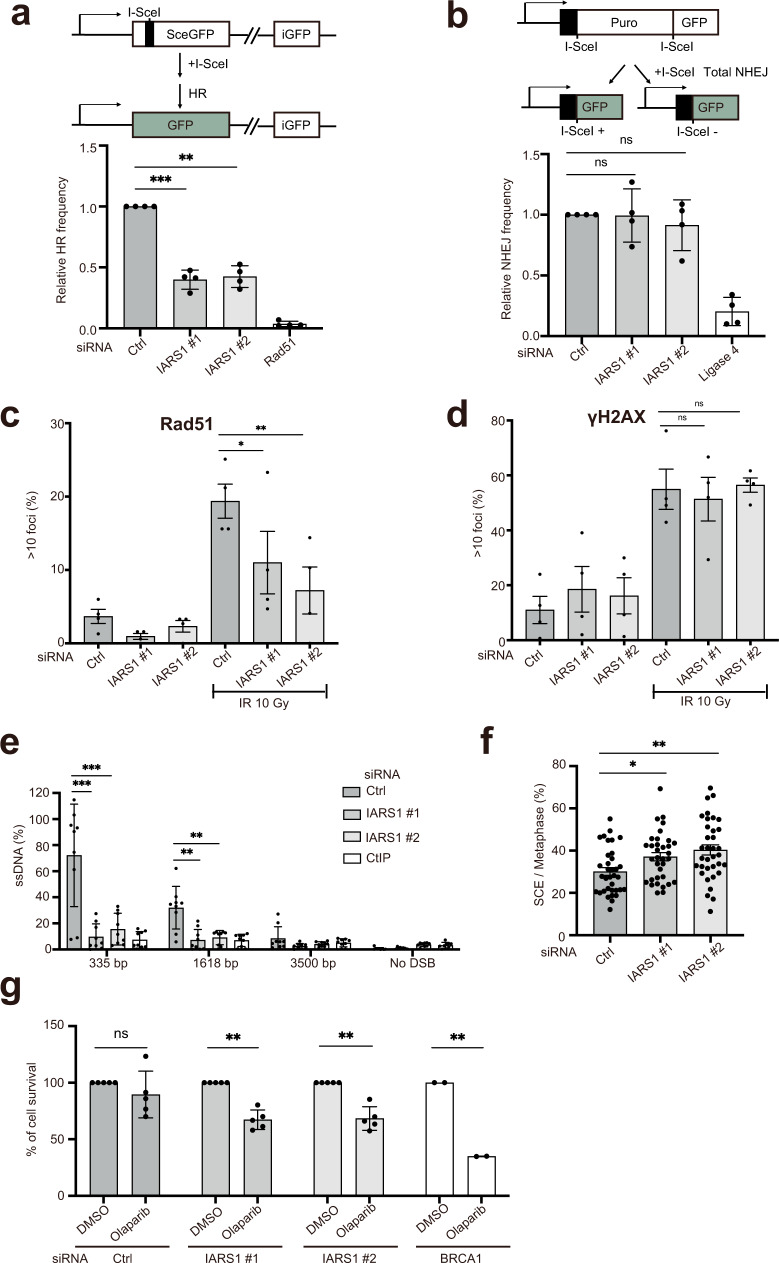
Fig. 5. Downregulation of BRCA1 upon IARS1 depletion leads to impaired DNA repair.
a Schematic of the DR-GFP reporter assay (top). I-SceI-DSB-induced HR efficiencies were determined in DR-U2OS cells upon treatment with control siRNA, two siRNAIARS1, or siRNARad51 (bottom). b Schematic of the EJ5-GFP reporter assay (top). The efficiency of NHEJ in EJ5-U2OS cells was measured after transfection of control, two siRNAIARS1, or siRNALigase4 (bottom). Data are represented as mean values ± SD (n = 4, independent experiments) in a and b. **P < 0.01, ***P < 0.001, ns, not significant by the analysis of two-tailed paired Student’s t-test. c Quantification of Rad51 foci in U2OS cells treated with control siRNA or two siRNAIARS1 after exposure to 10 Gy ionizing radiation (IR) or sham irradiation. d Quantification of γH2AX in nuclei of U2OS cells treated with control siRNA or two siRNAIARS1 after exposure to 10 Gy IR or sham irradiation. The mean values ± standard error of the mean of four (siRNA Ctrl and siRNAIARS1#1 and #2) independent experiments are shown in c and d. *P < 0.05, **P < 0.01, ns, not significant by the analysis of two-tailed paired Student’s t-test. e Quantification of resected ssDNA at DSB sites using the ER-AsiSI system upon treatment with control siRNA, two siRNAIARS1 or siRNACtIP. After 4-OHT treatment for 4 hr to induce DSBs, resected DNA was quantified by qPCR at the indicated nucleotides from AsiSI-induced DSBs. The mean values ± SD of three (siRNA Ctrl, siRNAIARS1#1 and #2, and CtIP) independent experiments are shown. **P < 0.01, ***P < 0.001 by the analysis of two-tailed paired Student’s t-test. f SCE analysis in HeLa cells treated with control siRNA or two siRNAIARS1. The mean values ± SD of SCE/Total metaphase chromosome (n = 35 cells) are shown. *P < 0.05, **P < 0.01 by the analysis of two-tailed paired Student’s t-test. g Clonogenic survival of HeLa cells upon treatment with control siRNA, two siRNAIARS1, or siRNABRCA1 was measured after continuous exposure to olaparib for about 2 weeks. The mean values ± SD of five (siRNA Ctrl and siRNAIARS1#1 and #2) or two (siRNABRCA1) independent experiments are shown. **P < 0.01, ns, not significant by the analysis of two-tailed paired Student’s t-test. a–g Source data are provided as a Source Data file.

