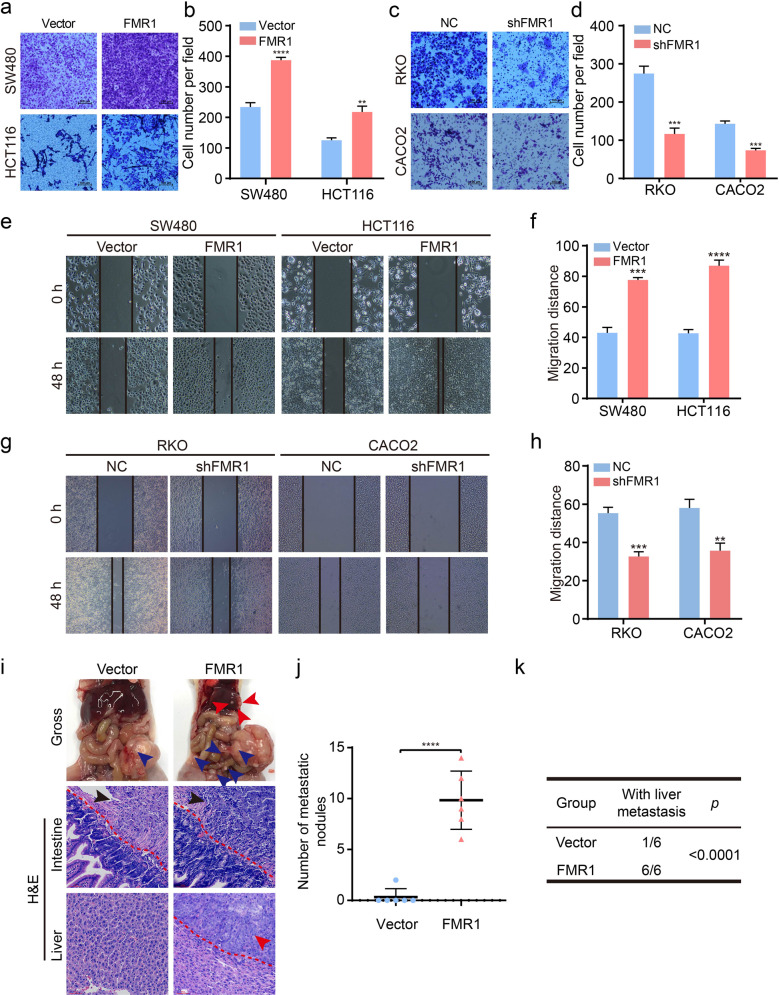
Fig. 3. FMR1 facilitates the metastasis of CRC cells in vitro and in vivo.
a–d Representative results of transwell assays. The bar chart represents the migration cell numbers. Error bars represent the means ± SD of 3 different fields. e–h Representative results of wound healing assays. The bar chart represents the migration distance. Error bars represent the means ± SD of 3 different fields. i Representative gross images of the orthotopic mouse metastatic model from different experimental groups are shown. Sections of the liver were stained with H&E. j The statistical analysis of number of liver metastatic nodules. Error bars represent the means ± SD. k The statistical distribution of metastasis numbers. **P < 0.01, ***P < 0.001, ****P < 0.0001.

