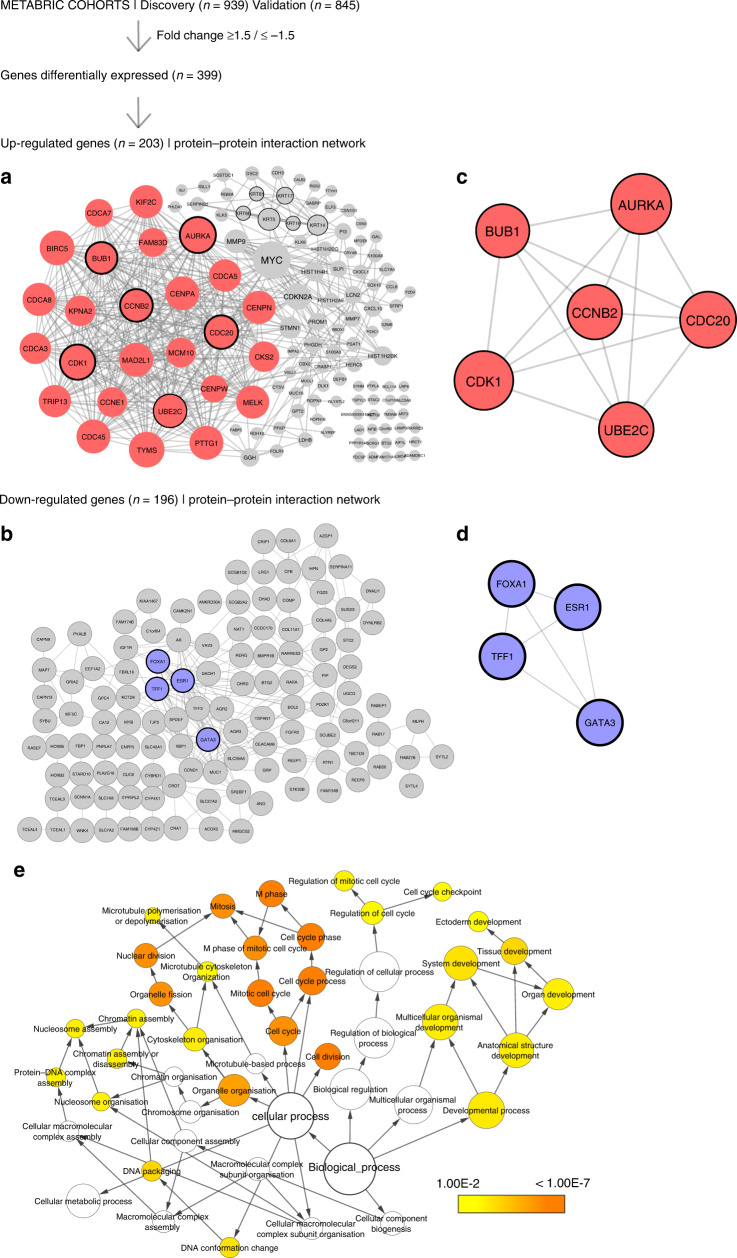
Fig. 1. The workflow from analyses of the METABRIC discovery (n = 939) and validation (n = 845) cohorts.
SAM analysis revealed 399 differentially expressed genes (DEGs) with fold change >1.5/<1.5 (FDR = 0.006%). Two protein–protein interaction (PPI) networks were established and visualised in Cytoscape, representing the identified upregulated (a) and downregulated (c) DEGs with their respective subclusters detected by MCODE (b, d). The Cytoscape App CytoHubba identified six hub genes (circled) in the upregulated network: CCNB2, AURKA, CKD1, BUB1, CDC20, UBE2C and four hub genes in the downregulated network: TFF1, FOXA1, ESR1, GATA3. Visualisation of Gene Ontology (GO) biological processes (BP) in the protein–protein network performed by the Cytoscape App BiNGO (e). The size of a node indicates the number of genes enriched in this term. The colour represented its P value, the smaller the p value, the darker the node is. The arrows represent progression of BP terms.

