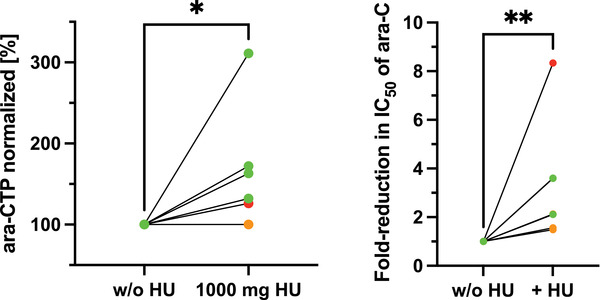
Fig. 4.

Effect of hydroxyurea on peak ara‐C triphosphate (ara‐CTP) levels in circulating mononuclear cells and ex vivo sensitivity to ara‐C. The left panel shows ara‐CTP levels measured in circulating mononuclear cells without hydroxyurea (w/o HU) as compared to ara‐CTP with hydroxyurea 1000 mg taken p.o. 1 h prior to start of ara‐C infusion, normalised to without hydroxyurea (n = 6). The right panel shows the fold reduction in IC50 values of ara‐C in diagnostic bone marrow mononuclear cells treated ex vivo in the presence or absence of 100 μM hydroxyurea, normalised to the absence of hydroxyurea (n = 7). Individual dots correspond to individual patients; colours represent levels of SAMHD1 expression at diagnosis (green, <25%, orange 25%–75% and red >75%).
