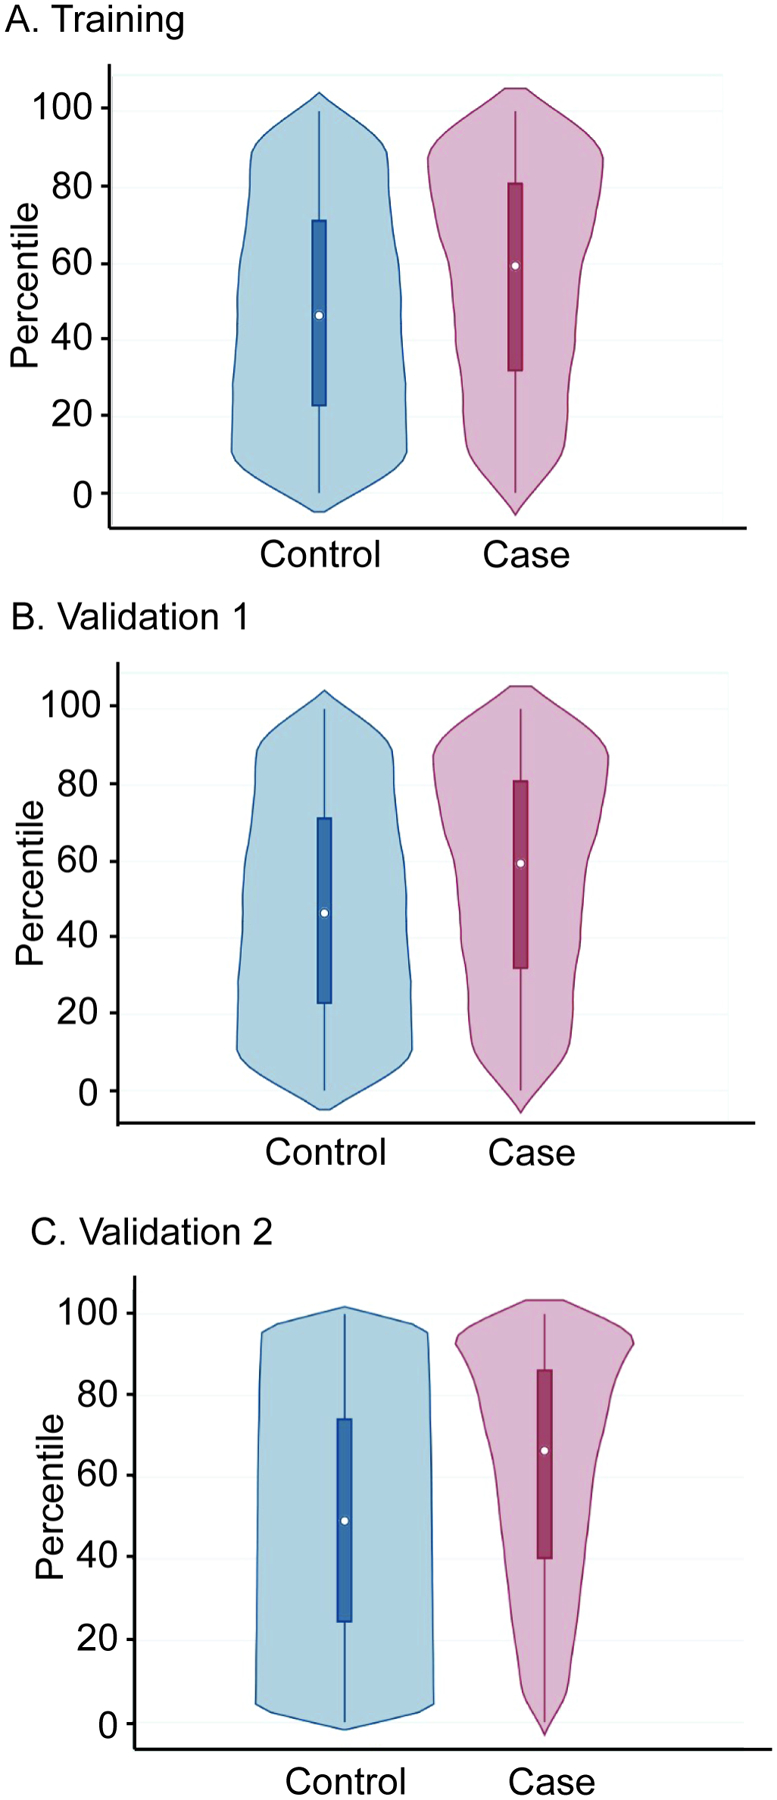
Figure 3. PRS percentile comparison between pediatric patients with asthma and controls.

The violin plots of the median ancestry standardized PRS distributions between cases and controls in pediatric Training (A), Validation 1 (B), and Validation 2 cohorts. In the boxplot insert, the dot within each box indicates the median score. In the Training cohort (A), the median standardized score of cases was 60% vs 47% in controls (p<0.0001). In the Validation 1 cohort (B), the median standardized score of cases was 58% vs 48% in controls (p<0.0001). In the Validation 2 cohort (C), 67% in cases versus 49% in controls (p<0.0001). The top and bottom of the boxes indicate the interquartile range (75th and 25th percentiles), respectively.
